
Beschreibung
Flintridge Trader Pro markiert Stellen, an denen der Preis bereits seine Absicht gezeigt hat, und sagt Ihnen dann, wann der Markt an diesen Stellen dreht.
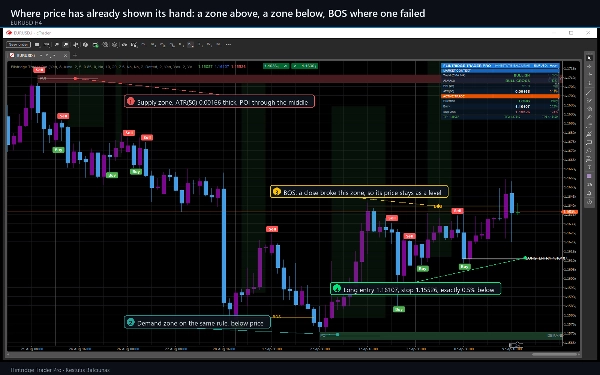
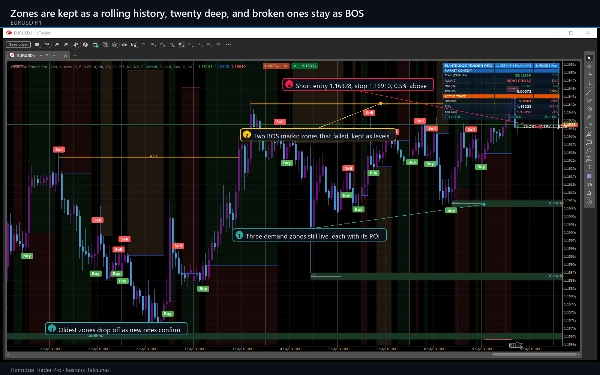
Bestätigte Swing-Pivots bilden Angebots- und Nachfragezonen, jede eine ATR-dicke Bandbreite mit ihrem Interessenspunkt in der Mitte. Wenn der Preis durch eine Zone schließt, wird dies in einen Strukturbruch umgewandelt und als BOS markiert, sodass das gescheiterte Niveau als Information auf dem Chart bleibt, anstatt zu verschwinden. Separat wird ein gleitender Durchschnitt der Schlusskurse und ein gleitender Durchschnitt der Eröffnungskurse auf einem HÖHEREN Zeitrahmen berechnet – standardmäßig das Achtfache Ihres Charts – und deren Kreuzung ist das Signal.
Was es auf Ihrem Chart zeichnet
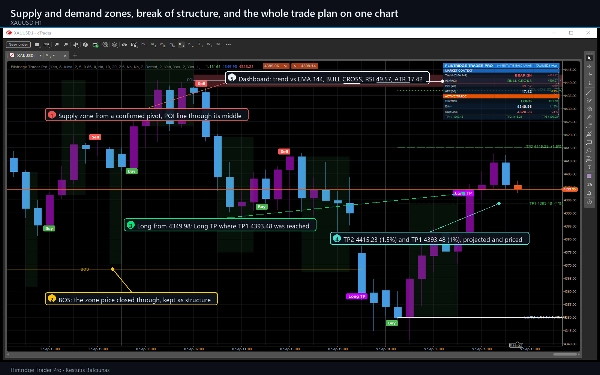
- Angebots- und Nachfragezonen aus bestätigten Swing-Pivots, jeweils mit einer POI-Linie, als rollierende Historie geführt und bei Bruch in eine BOS-Markierung umgewandelt.
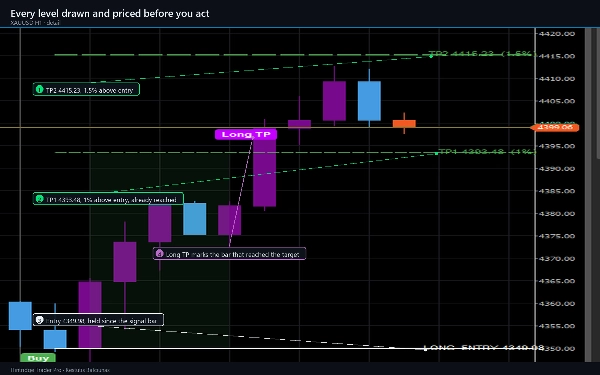
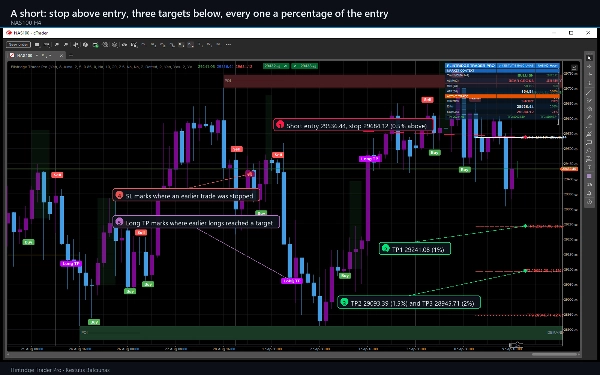
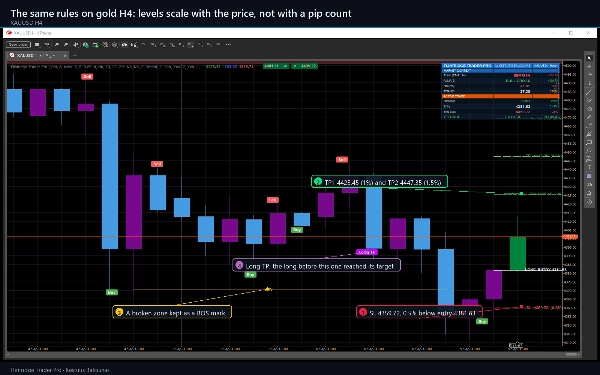
- Kauf- und Verkaufsmarker sowie Long-TP- und SL-Marker, wenn ein Niveau erreicht wird.
- Der Einstieg, der Stop und das erste Ziel als gestufte Linien, mit einem schattierten Risikoband und einem schattierten Gewinnband dazwischen.
- Das letzte Signal nach vorne projiziert, mit dem Einstieg, dem Stop und allen drei Zielen, gezeichnet und mit ihrem Preis und Prozentsatz beschriftet.
- Optionale HH-, LH-, HL- und LL-Swing-Labels sowie eine optionale Unterstützungs- und Widerstandsebene mit bis zu 21 Niveaus und deren Zonen.
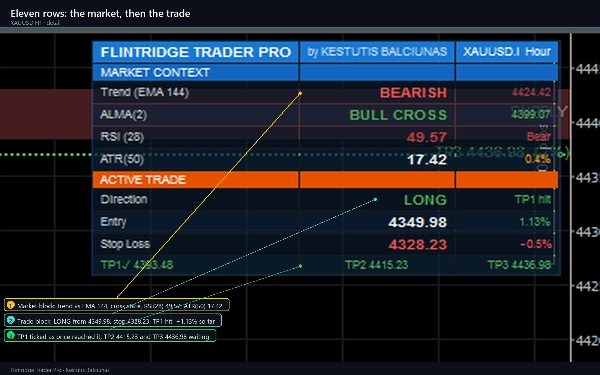
- Ein Dashboard mit elf Reihen: Trend gegen den 144 EMA, der Kreuzungszustand, RSI, ATR, dann der Live-Trade mit seiner Richtung, Phase, Einstieg, Stop und drei Zielen, von denen jedes abgehakt wird, sobald der Preis es erreicht.
- Kerzen werden umgefärbt, sodass die Richtung jeder Kerze auf einen Blick erkennbar ist.
Wie man damit handelt
- Geben Sie ihm Historie. Bei den Standardeinstellungen benötigt es etwa 250 Bars, bevor etwas erscheint, und es braucht genügend Daten im höheren Zeitrahmen, damit die erste Kreuzung existiert.
- Lesen Sie zuerst die Zonen. Ein Kauf innerhalb einer Nachfragezone und ein Verkauf innerhalb einer Angebotszone sind die Setups, die das Tool Ihnen zeigen soll.
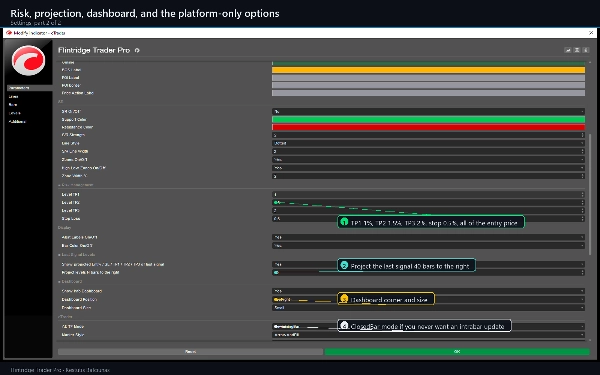
- Nehmen Sie die gezeichneten Niveaus so, wie sie sind. Der Stop und die drei Ziele sind Prozentsätze des Einstiegspreises, standardmäßig 0,5, 1, 1,5 und 2, und alle sind auf dem Chart, bevor Sie handeln.
- Verwenden Sie das Dashboard für Kontext, nicht als Erlaubnis. Trend, Kreuzung, RSI und ATR beschreiben den Markt; keiner von ihnen blockiert ein Signal, es sei denn, Sie schalten die optionalen Filter ein.
Wichtigste Einstellungen
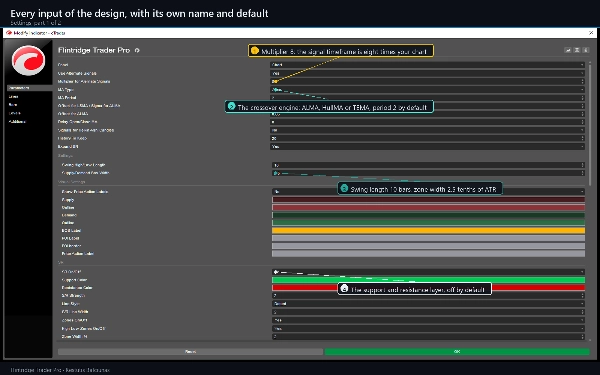
- MA-Typ und MA-Periode wählen den Kreuzungsmechanismus: ALMA, HullMA oder TEMA.
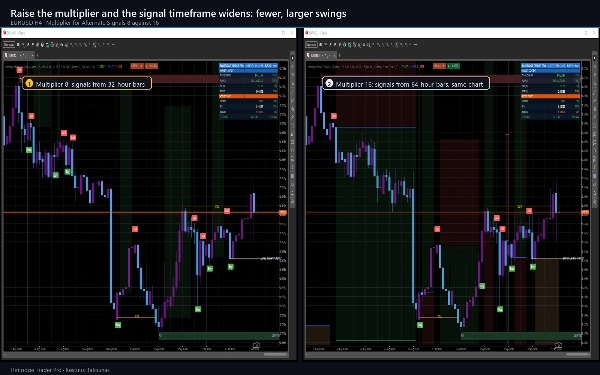
- Multiplikator für alternative Signale legt fest, wie viel höher der Signalzeitrahmen im Vergleich zu Ihrem Chart ist.
- Swing High/Low Länge und Breite der Angebots-/Nachfragebox steuern, wie viele Zonen Sie erhalten und wie dick sie sind.
- Level TP1, TP2, TP3 und Stop Loss sind Prozentsätze des Einstiegs, und Shorts verwenden dieselben vier Zahlen.
- Drei optionale Filter – ein EMA 144 Trendtor, ein RSI-Tor und ein Mindestabstand zwischen den Bars für Einstiege – sind für Trader vorgesehen, die weniger Signale wünschen. Sie sind standardmäßig AUS.
Wo es funktioniert
Jedes Symbol und jeder Zeitrahmen. Es wurde für M15, H1 und H4 entwickelt und fühlt sich zu Hause bei Forex-Majors, Gold und den großen Indizes; es funktioniert auch bei Krypto, wo die Zonen tendenziell breiter sind, weil der ATR es ist. Niedrigere Zeitrahmen liefern viel mehr Signale, was durch die optionalen Filter und den Multiplikator für den höheren Zeitrahmen gesteuert wird.
Alarme
Zwölf Ereignisse, jeweils mit eigenem Schalter: Long- und Short-Einstiege, die drei Ziele für jede Richtung und die Stops. Sie gehen ins cTrader-Protokoll, optional mit Ton und per E-Mail von cTrader selbst. Alarme werden nur bei geschlossenen Bars ausgelöst, niemals für Historie, die vor dem Anfügen des Indikators geschlossen wurde, und niemals zweimal für denselben Bar.
Anforderungen und Verhalten
cTrader 5.0 oder neuer, Desktop. Der Indikator verlangt keine Zugriffsrechte: Er öffnet keine Netzwerkverbindung, liest keine Datei und platziert, ändert oder schließt niemals eine Order. Ein Signal wird auf einem geschlossenen Bar bewertet und bewegt sich danach nicht mehr. Zwei Dinge sind vorläufig, während der neueste Bar sich bildet – die neueste Zone, deren Pivot noch nicht bestätigt ist, und der Wert des höheren Zeitrahmens, der vom Bar gelesen wird, der den aktuellen enthält. Es gibt eine Einstellung, um stattdessen den vorherigen abgeschlossenen Bar des höheren Zeitrahmens zu lesen, der niemals neu gezeichnet wird.
Dies ist analytische Software und nichts davon ist eine Empfehlung. Die Ziel- und Stop-Marken zeigen nur an, dass der Preis ein auf der geladenen Historie gezeichnetes Niveau berührt hat; es gibt keinen Spread, keine Kommission oder Slippage dahinter und keine Order wurde platziert.
Handel beinhaltet Risiken. Vergangene Leistungen garantieren keine zukünftigen Ergebnisse.
Zusammenfassung
Key chart elements include supply and demand zones with points of interest, buy/sell markers, entry, stop loss, and three target levels displayed as stepped lines with shaded risk and reward bands. Optional swing labels (HH, LH, HL, LL) and a support/resistance layer with up to 21 levels are available. An eleven-row dashboard provides market context with trend, crossover state, RSI, ATR, and live trade details including stage, entry, stop, and targets.
Flintridge Trader Pro supports any symbol and timeframe, optimized for M15, H1, and H4 charts, and is suitable for forex majors, gold, major indices, and cryptocurrencies. It includes configurable settings for moving average type, swing length, zone width, and risk parameters. Alerts cover entries, targets, and stops, firing on closed bars only. The indicator is analytical software that does not place or manage orders.






















![„High-Low Divergence [Iridio Capital]“-Logo](https://cdn.ctrader.com/image/webp/10a9e91b-243a-43f6-bbfe-7376bad5a214_61554)