Automatic Fibonatti - Renko
Indikator
Version 1.0, Feb 2025
Windows, Mac
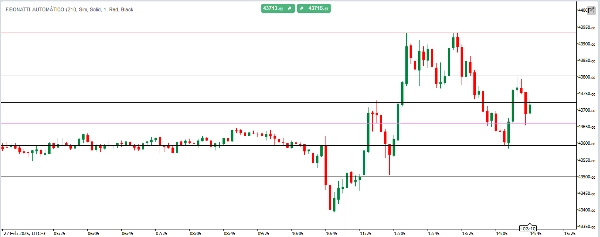
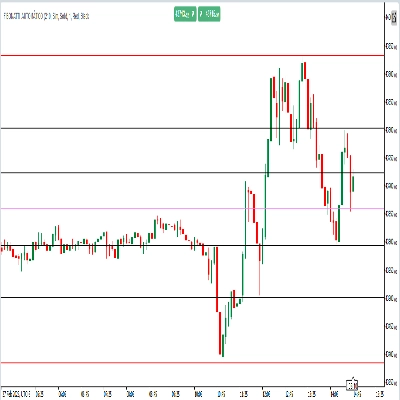
Auto Fibonacci RENKO für cTrader
Identifizieren Sie automatisch wichtige Preisniveaus – vollständig an Ihre Strategie anpassbar.
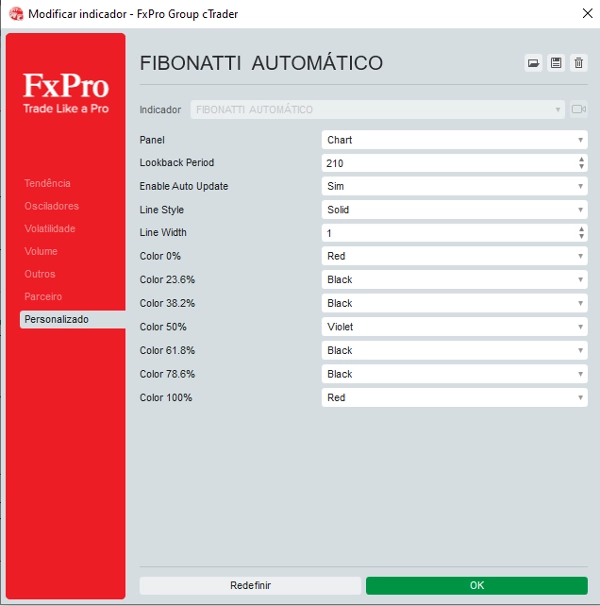
Auto Fibonacci ist ein intelligenter und flexibler Indikator, der automatisch Fibonacci-Retracement-Level basierend auf den höchsten und niedrigsten Preisen über einen benutzerdefinierten Zeitraum zeichnet. Was ihn auszeichnet, ist seine vollständige Anpassung: Personalisieren Sie jede Fibonacci-Ebene in Bezug auf Farbe, Linienstil und Dicke, um Ihren visuellen Vorlieben und Ihrer Handelsstrategie gerecht zu werden. Es bietet außerdem Echtzeit-Updates, sodass Ihr Chart stets die neuesten Kursbewegungen widerspiegelt – ohne manuelle Anpassungen.
Indikatorprofil
0.0
Bewertungen: 0
Kundenbewertungen
Bisher gibt es keine Bewertungen für dieses Produkt. Haben Sie es schon ausprobiert? Dann können Sie die erste Person sein, die andere darüber informiert!
Über den cTrader Store verfügbare Produkte, einschließlich Handelsbots, Indikatoren und Plugins, werden von externen Entwicklern bereitgestellt und nur zu Informations- und technischen Zugriffszwecken verfügbar gemacht. cTrader Store ist kein Broker und erbringt keine Anlageberatung, persönlichen Empfehlungen oder eine Garantie für zukünftige Performance.


Seit 05/02/2025
30
Verkäufe