
Engulfing Pattern Indicator
Indikator
463 downloads
Version 1.0, Mar 2025
Windows, Mac
4.0
Bewertungen: 1
Seit 21/02/2025
466.3M
Gehandeltes Volumen
180.83K
Pip-Gewinn
22
Verkäufe
6.92K
Kostenlose Installationen
Beschreibung
Engulfing Pattern Indikator – Beschreibung
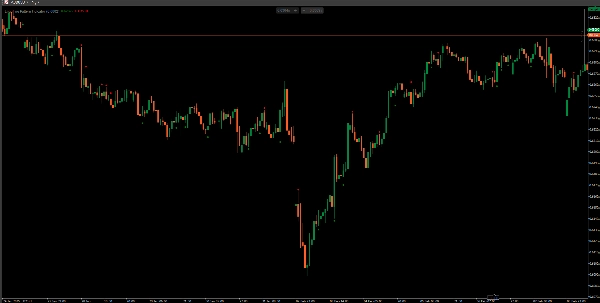
Der Engulfing Pattern Indikator erkennt bullische und bärische Engulfing-Kerzenmuster, die potenzielle Trendwenden signalisieren.
Wie es funktioniert
🔍 Bullish Engulfing:
- Die vorherige Kerze ist bärisch (Schluss < Eröffnung).
- Die aktuelle Kerze ist bullisch (Schluss > Eröffnung).
- Die bullische Kerze umschließt den Körper der vorherigen Kerze (Eröffnung < vorheriger Schluss & Schluss > vorherige Eröffnung).
- Grüner Marker wird unter dem Muster platziert.
🔍 Bearish Engulfing:
- Die vorherige Kerze ist bullisch (Schluss > Eröffnung).
- Die aktuelle Kerze ist bärisch (Schluss < Eröffnung).
- Die bärische Kerze umschließt den Körper der vorherigen Kerze (Eröffnung > vorheriger Schluss & Schluss < vorherige Eröffnung).
- Roter Marker wird über dem Muster platziert.
Hauptmerkmale
✅ Erkennt starke Umkehrsignale in der Kursentwicklung.
✅ Funktioniert auf allen Zeitrahmen und Märkten (Forex, Aktien, Krypto).
✅ Hilft Händlern, hochwahrscheinliche Handelsmöglichkeiten an Schlüsselstellen zu erkennen.
📌 Beste Anwendung: Kombinieren Sie es mit Unterstützungs-/Widerstandsniveaus und Trendanalysen für höhere Genauigkeit! 🚀
Zusammenfassung
KI-Zusammenfassung
The Engulfing Pattern Indicator identifies bullish and bearish engulfing candlestick patterns, which are signals of potential trend reversals in price action. It works by detecting when a current candle fully engulfs the body of the previous candle under specific conditions:
- Bullish Engulfing occurs when a bearish candle is followed by a larger bullish candle that engulfs the previous candle’s body. A green marker is plotted below this pattern.
- Bearish Engulfing occurs when a bullish candle is followed by a larger bearish candle that engulfs the previous candle’s body. A red marker is plotted above this pattern.
This indicator operates across all timeframes and markets, including Forex, Stocks, and Crypto. It helps traders identify strong reversal signals and high-probability trade setups at key levels. For improved accuracy, it is recommended to use this indicator in combination with support/resistance and trend analysis.
Indikatorprofil
Kundenbewertungen
4.0
Bewertungen: 1
5 | 0 % | |
4 | 100 % | |
3 | 0 % | |
2 | 0 % | |
1 | 0 % |
Kundenbewertungen
August 12, 2025
Pros: Accurate detection of bullish and bearish engulfing patterns, customizable settings, stable performance. Cons: No alerts, no MTF mode, no trade statistics.
Diskussion
Häufig gestellte Fragen (FAQ)
Forex
Signal
Crypto
Stocks
Über den cTrader Store verfügbare Produkte, einschließlich Handelsbots, Indikatoren und Plugins, werden von externen Entwicklern bereitgestellt und nur zu Informations- und technischen Zugriffszwecken verfügbar gemacht. cTrader Store ist kein Broker und erbringt keine Anlageberatung, persönlichen Empfehlungen oder eine Garantie für zukünftige Performance.


Preis
Seit 21/02/2025
466.3M
Gehandeltes Volumen
180.83K
Pip-Gewinn
22
Verkäufe
6.92K
Kostenlose Installationen