
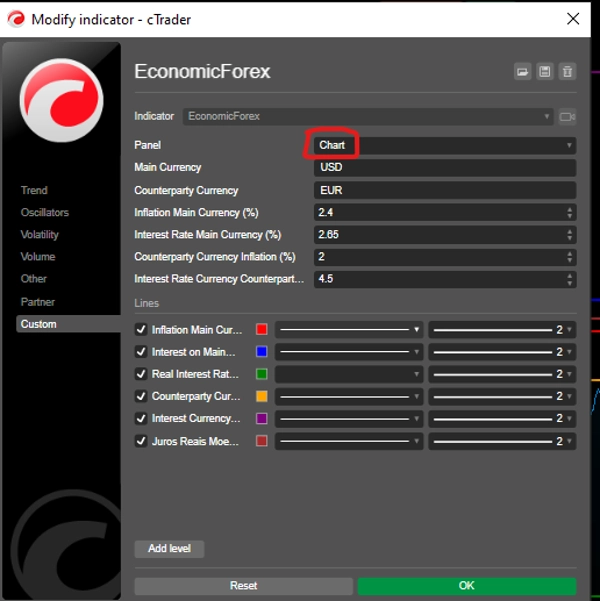
✔ Website zur Dateneingabe, geben Sie den Indikatoren-Tab ein: https://tradingeconomics.com/
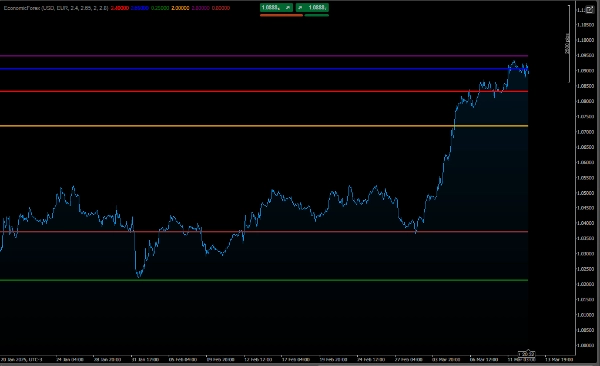
Wie man das Diagramm interpretiert
Unterschied zwischen nominalen und realen Zinssätzen:
Der nominale Zinssatz ist der Bruttowert des Zinssatzes.
Der reale Zinssatz berücksichtigt die Inflation und zeigt die reale Kaufkraft des Geldes.
Wenn die Inflation höher als der nominale Zinssatz ist, wird der reale Zinssatz negativ sein, was auf einen Kaufkraftverlust hinweist.
Währungsvergleich:
Das Diagramm ermöglicht den Vergleich der wirtschaftlichen Bedingungen der beiden Währungen.
Zum Beispiel, wenn der reale Zinssatz der Hauptwährung höher ist als der der Gegenwährung, kann dies darauf hinweisen, dass die Hauptwährung für Investitionen attraktiver ist.
Entwicklung im Zeitverlauf:
Die Linien zeigen, wie sich Inflation, nominale und reale Zinssätze im Laufe der Zeit ändern, sodass Sie Trends erkennen können.
Anwendungsbeispiel
Angenommen, Sie setzen die Parameter wie folgt:
Hauptwährung: USD (US-Dollar)
Inflation: 5%
Nominaler Zinssatz: 6,5%
Gegenwährung: EUR (Euro)
Inflation: 2%
Nominaler Zinssatz: 4%
Das Diagramm zeigt:
USD:
Realer Zinssatz: 1,5% (6,5% - 5%)
EUR:
Realer Zinssatz: 2% (4% - 2%)
Damit können Sie die wirtschaftlichen Bedingungen von USD und EUR vergleichen und fundierte Entscheidungen auf dem Forex-Markt treffen.
Fazit
Dieser Code ist ein nützliches Werkzeug für Händler und Analysten, die wirtschaftliche Indikatoren zweier Währungen in einem Forex-Paar überwachen und vergleichen möchten. Er liefert Einblicke in Inflation, nominale Zinssätze und reale Zinssätze und hilft, das makroökonomische Szenario und dessen Auswirkungen auf den Forex-Markt zu verstehen.
Siehe diesen risikoarmen Algorithmus:👇🏻
https://ctrader.com/pt/products/601?u=carneiroads
https://ctrader.com/pt/products/623?u=carneiroads


