
Descripción
Taiz Pro Volume Profile: La herramienta definitiva de análisis para descubrir las intenciones del mercado
¿Estás cansado de depender de indicadores rezagados que no te dan la imagen completa? El indicador Taiz Pro Volume Profile no es solo otra herramienta, es tu ventana para ver lo que sucede "detrás de escena" en el mercado.
A diferencia de los indicadores de volumen tradicionales que muestran "cuándo" se negoció, este indicador revela "dónde" se negoció, dándote una ventaja competitiva real.
---
· ¿Qué te ofrece este indicador?
o 📈 Identificación de zonas de alta liquidez: Descubre los niveles de precios donde se concentran los mayores volúmenes de negociación. Estas son las zonas defendidas por los creadores de mercado y las grandes instituciones.
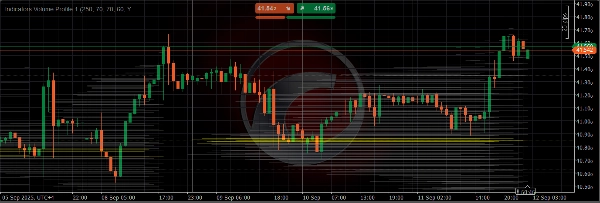
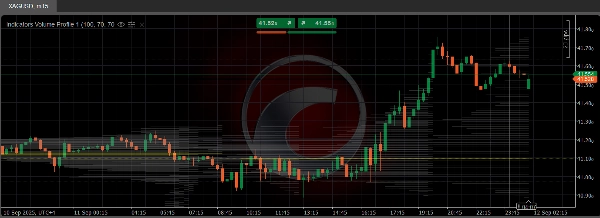
o 🎯 Punto de control (Point of Control - POC):* El indicador te muestra claramente (con la línea amarilla) el nivel de precio donde ocurrió el mayor volumen de negociación. Este nivel actúa como un imán para el precio y una zona de soporte o resistencia muy importante.
o 📊 Área de valor (Value Area - VA): Define el rango de precios (en gris) donde se realizaron el 70% de las transacciones. Operar por encima de esta zona es una señal alcista fuerte, y operar por debajo es una señal bajista.
o 💡 Decisiones de trading más inteligentes: Usa estas zonas para identificar puntos de entrada con alta precisión, colocar órdenes de stop loss en lugares seguros y establecer objetivos realistas para obtener ganancias.
---
· ¿Por qué este indicador es mejor?
o Precisión computacional superior: Utiliza un algoritmo avanzado para distribuir el volumen con precisión en cada movimiento de precio, lo que ofrece un resultado más realista.
o Facilidad de uso: Interfaz simple y configuraciones claras que te permiten personalizar el indicador para que se adapte a tu estilo de análisis.
o Rendimiento estable: El código está diseñado para ser ligero y estable, garantizando que no ralentice tu plataforma cTrader.
Lleva tu análisis técnico al siguiente nivel. Comienza a operar basándote en datos reales, no solo en suposiciones. Descarga el indicador ahora.
Resumen
Key features include:
- High liquidity zones: Identifies price levels with the largest traded volumes, often defended by market makers and institutions.
- Point of Control (POC): Marks the price level with the highest volume using a yellow line, serving as a critical support or resistance area.
- Value Area (VA): Displays the price range where 70% of trading volume occurred, shaded in gray; trading above this area suggests bullish momentum, while below indicates bearish signals.
- Precision trading decisions: Helps users pinpoint entry points, set stop-loss orders safely, and establish realistic profit targets.
The indicator employs an advanced algorithm for accurate volume distribution across price movements, ensuring realistic results. It features a user-friendly interface with customizable settings and is optimized for stable, lightweight performance on the cTrader platform.
Applicable markets include Forex, indices, commodities, stocks, and cryptocurrencies, supporting symbols like EURUSD, GBPUSD, XAUUSD, BTCUSD, NAS100, and others. This tool aids traders in making data-driven decisions based on volume profile analysis.
Valoraciones de clientes
5 | 0 % | |
4 | 100 % | |
3 | 0 % | |
2 | 0 % | |
1 | 0 % |


![Logotipo de "[Stellar Strategies] Market Session Ultimate"](https://cdn.ctrader.com/image/webp/61ffd537-0125-4246-9e72-42eca1791d64_28232)


