ADX Indicator_noSourceCode
Indicador
Versión 1.0, Sep 2025
Windows, Mac
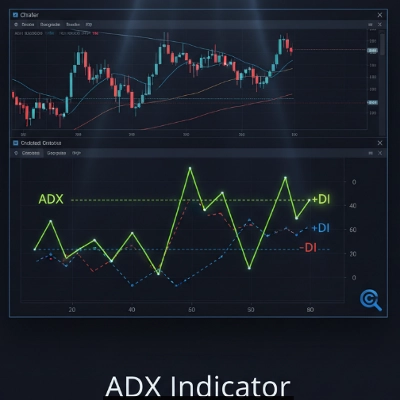
Identifica la Fuerza de la Tendencia con Precisión Absoluta en cTrader
¿Cansado de operar en contra de la tendencia? Te presentamos el ADX Indicator Pro, la herramienta definitiva para descifrar la fuerza y dirección del mercado, diseñada especialmente para tu plataforma cTrader.
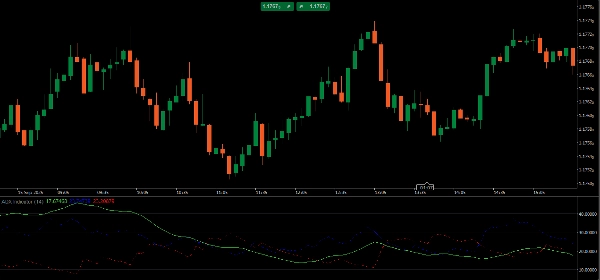
Este indicador no es solo otra línea en tu gráfico. Es tu brújula del mercado, con un cálculo optimizado y un diseño visual limpio para que tengas la información que necesitas en el momento exacto.
Con nuestro ADX Indicator, podrás:
- Entender la Tendencia: Descubre al instante si el mercado tiene la fuerza para un movimiento al alza o a la baja.
- Evitar Trampas: Deja de operar en mercados laterales y perder tiempo y dinero. El ADX te muestra cuándo la tendencia es débil.
- Operar con Confianza: Con la línea ADX, el +DI y el -DI, obtienes la visualización completa para tomar decisiones más seguras e inteligentes.
Listo para usar, impecable y con un diseño enfocado en tu rendimiento. Eleva tu análisis de mercado y toma el control de tus operaciones.
Perfil del indicador
0.0
Valoraciones: 0
Valoraciones de clientes
Este producto todavía no se ha valorado. ¿Ya lo ha probado? Sea el primero en informar a otros.
Prop
Forex
Indices
Commodities
Crypto
Stocks
Los productos disponibles a través de cTrader Store, incluidos bots, indicadores y plugins para operar, son proporcionados por desarrolladores de terceros y están disponibles únicamente con fines informativos y de acceso técnico. cTrader Store no es un bróker, por lo que no proporciona asesoramiento de inversión, recomendaciones personales ni ninguna garantía de rentabilidad futura.


![Logotipo de "Gaussian Channel [Iridio Capital]"](https://cdn.ctrader.com/image/webp/7c039209-5573-4a54-a072-f9528b503103_41960)


Desde 05/02/2025
30
Ventas