Candle Pro
Indicador
121 descargas
Versión 1.0, Oct 2025
Windows, Mac
5.0
Valoraciones: 1
Descripción
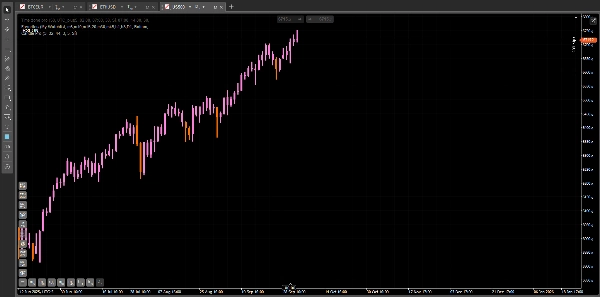
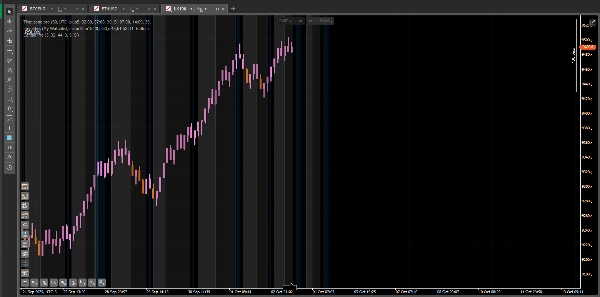
Candle Pro – Señales visuales de RSI en velas
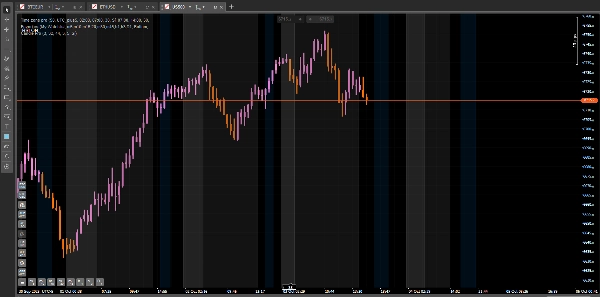
Candle Pro es un indicador que resalta las velas directamente en el gráfico cuando el RSI alcanza niveles de sobrecompra o sobreventa, manteniendo tu enfoque en la acción del precio y evitando subgráficos adicionales.
🧭 Cómo usar
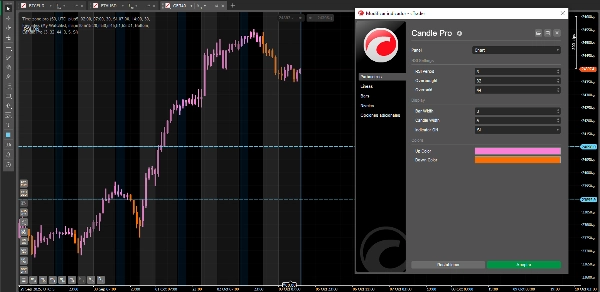
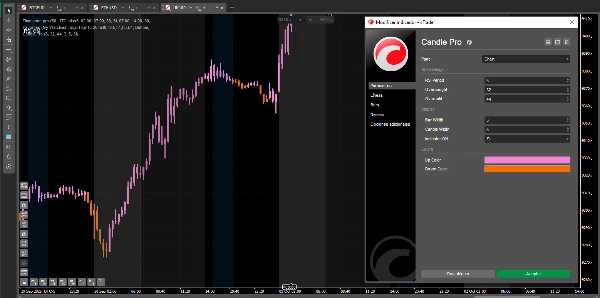
- Agrega el indicador a tu gráfico.
- Ajusta los parámetros del RSI para que se adapten a tu estilo de trading.
- Observa cómo las velas cambian de color en niveles extremos, marcando zonas potenciales de reversión o impulso.
⚙️ Configuraciones sugeridas
Para una respuesta rápida y precisa:
- Periodo RSI: 3
- Sobrecompra: 32
- Sobreventa: 44
- Ancho de vela: 3
- Ancho de barra: 1
✨ Beneficios
- Señales visuales limpias directamente en el precio.
- Funciona con cualquier símbolo y marco temporal.
- Colores y anchos de línea totalmente personalizables.
- Perfecto para scalping, intradía y swing trading.
Nota: Esta es la versión gratuita de Candle Pro. Próximamente llegará una versión premium, llena de funciones exclusivas para llevar tu trading al siguiente nivel.
Resumen
Resumen de IA
Candle Pro is a trading indicator designed to visually highlight RSI (Relative Strength Index) signals directly on price candles, eliminating the need for separate RSI sub-charts. It marks candles on the chart when RSI reaches overbought or oversold levels, helping traders identify potential reversal or momentum zones. Users can customize RSI parameters, candle colors, and line widths to suit their trading style. The indicator supports any symbol and timeframe, making it suitable for scalping, intraday, and swing trading strategies. Suggested settings include an RSI period of 3, overbought level at 32, and oversold level at 44 for fast and precise signals. Candle Pro emphasizes clean visual cues integrated with price action to maintain chart clarity. This version is the free edition, with a premium version planned to offer additional features. Supported markets include Forex, Indices, and Crypto.
Perfil del indicador
Valoraciones de clientes
5.0
Valoraciones: 1
5 | 100 % | |
4 | 0 % | |
3 | 0 % | |
2 | 0 % | |
1 | 0 % |
Valoraciones de clientes
November 3, 2025
This is an interesting indicator it really helps to filter out market noise. Thanks
Conversación
Preguntas frecuentes
Forex
Indices
RSI
Crypto
Los productos disponibles a través de cTrader Store, incluidos bots, indicadores y plugins para operar, son proporcionados por desarrolladores de terceros y están disponibles únicamente con fines informativos y de acceso técnico. cTrader Store no es un bróker, por lo que no proporciona asesoramiento de inversión, recomendaciones personales ni ninguna garantía de rentabilidad futura.


Precio
Desde 24/02/2025
15
Ventas
1.84K
Instalaciones gratis