
WAVETREND_withSourceCode
Indicador
Versión 1.0, Oct 2025
Windows, Mac
5.0
Valoraciones: 2
Descripción
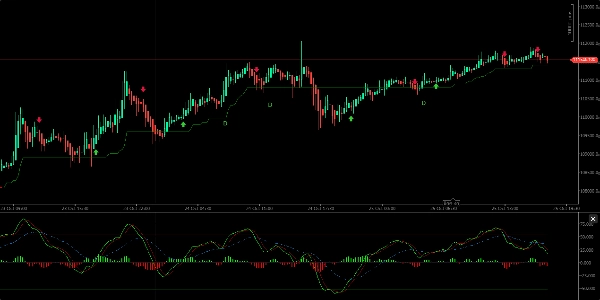
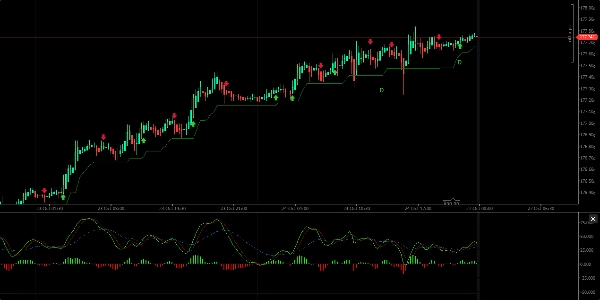
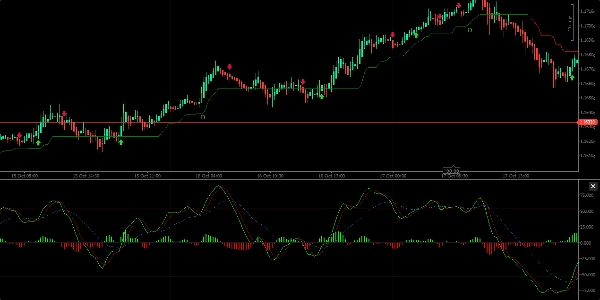
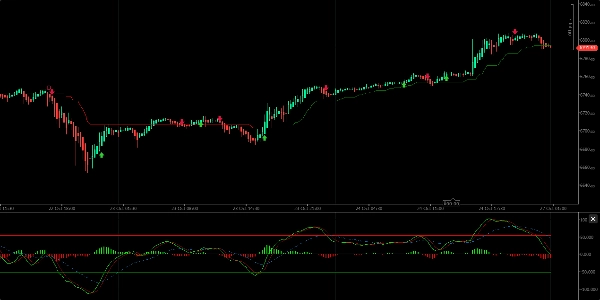
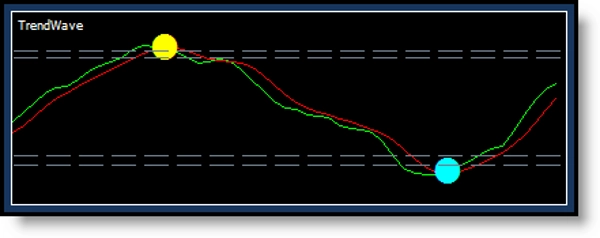
Proporciona señales de compra-venta, indicación de la dirección de la tendencia e identifica zonas de sobrecompra y sobreventa. Visualmente, consta de dos líneas de valor con una nube/histograma en el centro, que se mueve por encima y por debajo de una línea media, representando tendencias ascendentes o descendentes.
Características clave:
- Las señales de compra ocurren cuando la línea verde cruza hacia arriba la línea roja; las señales de venta cuando la línea verde cruza hacia abajo.
- Muestra la dirección de la tendencia con ondas de nube por encima o por debajo de la línea media.
- El indicador muestra puntos verdes (compra) y rojos (venta) en los puntos de cruce, con cambios de color correspondientes en las velas (amarillo para compra, turquesa para venta).
- Se recomienda usarlo en intervalos de 12 horas o 1 día para evitar ruido excesivo a corto plazo.
- El indicador puede identificar divergencias entre el precio y el momentum (divergencia alcista y bajista regular), señalando posibles reversiones de precio.
- Se aconseja combinar WaveTrend con otros indicadores como WMA, CMF, RSI y MACD para decisiones de trading más confiables.
En general, WaveTrend es una herramienta funcional útil para identificar la dirección de la tendencia y señales de trading, pero debe usarse junto con otras herramientas de análisis para confirmación.
Resumen
Perfil del indicador
Valoraciones de clientes
5.0
Valoraciones: 2
5 | 100 % | |
4 | 0 % | |
3 | 0 % | |
2 | 0 % | |
1 | 0 % |
Valoraciones de clientes
November 6, 2025
the main upside is the trade idea gets slowed down first. The setup still needs say no.
Conversación
Preguntas frecuentes
Signal
ZigZag
EURUSD
Supertrend
GBPUSD
RSI
XAUUSD
NAS100
ATR
MACD
Los productos disponibles a través de cTrader Store, incluidos bots, indicadores y plugins para operar, son proporcionados por desarrolladores de terceros y están disponibles únicamente con fines informativos y de acceso técnico. cTrader Store no es un bróker, por lo que no proporciona asesoramiento de inversión, recomendaciones personales ni ninguna garantía de rentabilidad futura.


![Logotipo de "[Hamster-Coder] Moving Average MTF"](https://cdn.ctrader.com/image/webp/b11b98b1-194d-4b8e-b00e-d611826ad159_31226)


Precio
Desde 16/03/2025
256
Instalaciones gratis