Penerangan
TRB — Penunjuk Tick Runs Bars
Mengesan Maklumat Pasaran Sebelum Harga Bergerak
Harga pengenalan terhad untuk pengguna awal - dapatkan salinan anda sekarang pada kadar yang dikurangkan sebelum harga meningkat ke harga runcit standard selepas tempoh pelepasan awal berakhir.
Versi 1.1
Gunakan Bahagian Komen untuk meminta maklumat lanjut
Tersedia untuk Sesi Video dengan Panduan Persediaan selepas Pembelian
PENUNJUK TICK RUNS BARS (TRB)
Tick Runs Bars meluaskan analisis mikrostruktur pasaran dengan mengesan ketekalan arah dalam aliran dagangan. Juga berakar pada Advances in Financial Machine Learning oleh Marcos López de Prado, penunjuk ini mengenal pasti apabila tekanan pasaran sebelah satu menyimpang dari tahap yang dijangka — mendedahkan pemotongan pesanan institusi dan aktiviti dagangan berkoordinasi.
Wawasan Teras
Pedagang institusi melaksanakan pesanan besar secara strategik — mereka memotongnya menjadi bahagian lebih kecil, menyembunyikan volum di belakang pesanan iceberg, atau menggunakan pelaksanaan algoritma untuk mengelakkan pergerakan pasaran. Taktik ini meninggalkan cap jari yang jelas dalam bentuk larian dagangan sehala yang berterusan. Tick Runs Bars mengesan corak ini dengan mengukur berapa lama satu pihak menguasai aliran pesanan, mendedahkan apabila pesanan agresif yang disengajakan sedang berlaku dan bukannya turun naik harga rawak.
Cara Ia Berfungsi
Penunjuk mengira panjang volum larian beli dan volum larian jual secara berasingan — tidak mengimbangi antara satu sama lain seperti metrik ketidakseimbangan tradisional. Ia menjejaki pengumpulan volum sebelah satu maksimum (θT) berbanding ambang jangkaan dinamik yang diperoleh daripada kebarangkalian beli/jual sejarah dan volum purata. Apabila larian arah sebenar melebihi jangkaan, bar TRB baru dicetuskan. Ini mendedahkan "bentuk struktur" pelaksanaan aliran pesanan — tanda tangan pemain institusi yang sedang beraksi.
Ciri-ciri Utama
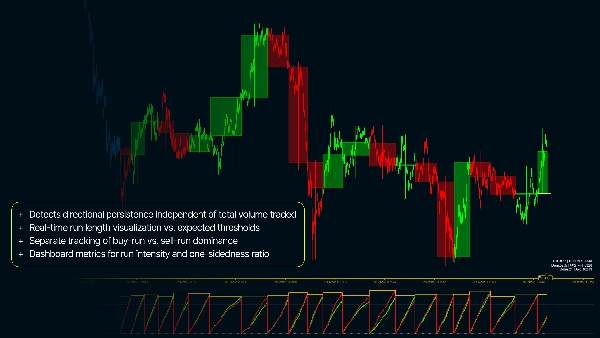
- Mengesan ketekalan arah tanpa mengira jumlah volum yang didagangkan
- Visualisasi panjang larian masa nyata berbanding ambang jangkaan
- Penjejakan berasingan dominasi larian beli vs. larian jual
- Pewarnaan lilin carta mengikut keanggotaan TRB menunjukkan fasa pelaksanaan pesanan
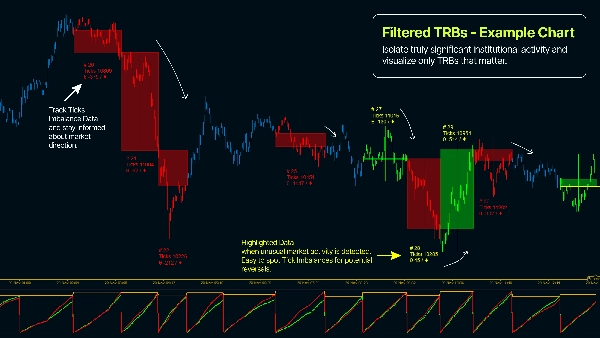
- Penapis Volum Minimum untuk mengasingkan aktiviti institusi yang benar-benar signifikan
- Metrik papan pemuka untuk intensiti larian dan nisbah sebelah satu
- Saiz Bar Jangkaan dan parameter EWMA yang boleh dikonfigurasikan disesuaikan dengan volatiliti instrumen
Mengapa Gunakan Tick Runs Bars?
- Kenal pasti pelaksanaan pesanan institusi secara masa nyata — sebelum selesai
- Mengesan kecairan tersembunyi dan corak pesanan iceberg melalui analisis aliran
- Membezakan dagangan berkoordinasi daripada bunyi pasaran rawak
- Menangkap pergerakan harga daripada ketidakseimbangan pesanan struktur, bukan hanya anomali statistik
- Masa kemasukan/keluaran semasa tempoh penyertaan institusi yang diketahui
- Mengaplikasikan teori mikrostruktur pasaran lanjutan untuk mendapatkan kelebihan pada jangka masa lebih pantas
- Mengurangkan isyarat palsu daripada lonjakan dagangan runcit kecil


![Logo "[Stellar Strategies] Smart ADX"](https://cdn.ctrader.com/image/webp/af13b084-b6f6-41db-b7bc-c7e688b57b05_36929)


