
Descripción
**Vmm Signal Trend Pro - Indicador para cTrader**
**Descripción General**
Vmm Signal Trend Pro es un indicador avanzado de análisis técnico para la plataforma cTrader que detecta múltiples patrones de precio en tiempo real. Combina detección de tendencias, patrones de velas, FVGs (Brechas de Valor Justo), gaps y otros patrones importantes en un solo indicador visual.
**Características Principales**
**1. Detección de Tendencias**
- **Análisis de Acción del Precio**: Identifica tendencias mediante la acción del precio en las últimas N velas
- **Fuerza de la Tendencia**: Calcula el porcentaje de fuerza basado en el momentum y la estructura
- **Iconos Direccionales**: Flecha verde (arriba) o flecha roja (abajo) cuando la tendencia es fuerte
**2. Patrones Detectados**
**Brecha de Valor Justo (FVG)**
- **FVG Alcista**: Cuando el mínimo actual > el máximo de hace 2 velas
- **FVG Bajista**: Cuando el máximo actual < el mínimo de hace 2 velas
- **Áreas Coloreadas**: Rectángulos semitransparentes (verde/naranja)
**Gaps**
- **Gap Alcista**: Apertura por encima del máximo anterior
- **Gap Bajista**: Apertura por debajo del mínimo anterior
- **Visualización**: Pequeños rectángulos en la apertura de la vela
**Inside Bars**
- Vela completamente dentro del rango de la vela anterior
- Diferenciación por color (amarillo/naranja) según la dirección
**Patrón 123 (Reverso)**
- **Patrón 123 Alcista**: Tres puntos con ruptura al alza
- **Patrón 123 Bajista**: Tres puntos con ruptura a la baja
- **Señalización**: Icono circular dorado
**Patrones de Mecha**
- **Tipo Martillo**: Mecha inferior significativa
- **Tipo Estrella Fugaz**: Mecha superior significativa
- **Icono**: Estrella magenta
**Pin Bars**
- Mecha larga (≥2x cuerpo) con cuerpo pequeño
- Detección de niveles clave cercanos
- **Iconos**: Triángulo arriba/abajo (cian)
**Engulfing**
- **Engulfing Alcista**: Vela alcista envuelve la vela bajista anterior
- **Engulfing Bajista**: Vela bajista envuelve la vela alcista anterior
- **Icono**: Diamante púrpura
**Doji**
- Cuerpo muy pequeño (≤10% del rango total por defecto)
- Tipos especiales: Gravestone, Dragonfly, Long-Legged
- **Icono**: Círculo gris
**3.** Sistema de Soporte/Resistencia**
- Detección automática de máximos/mínimos swing
- Considera proximidad a niveles clave para aumentar la importancia
**4. Filtrado Inteligente**
- **Límite por Tipo**: Número máximo de señales por categoría
- **Espaciado Temporal**: Evita señales demasiado cercanas
- **Filtro de Tendencia**: Opción para permitir/denegar señales contra tendencia
- **Fuerza Mínima**: Filtra señales débiles
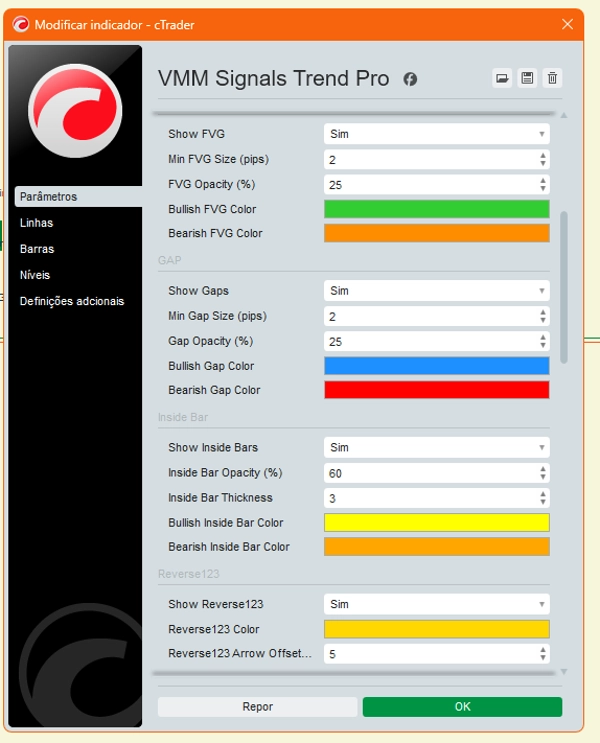
**Parámetros Configurables**
**Esenciales**
- `Mostrar Dirección de Tendencia`: Activa las flechas de tendencia
- `Chequeo de Velas Previas`: Número de velas para análisis
- `Umbral de Fuerza de Tendencia`: Porcentaje mínimo para considerar una tendencia fuerte
**FVG**
- `Tamaño Mínimo FVG`: Tamaño mínimo en pips
- `Opacidad`: Transparencia de las áreas
- `Colores`: Colores personalizables
**Gaps**
- `Tamaño Mínimo de Gap`: Tamaño mínimo en pips
- `Colores`: Colores para gaps alcistas/bajistas
**Inside Bars**
- `Grosor`: Grosor de línea
- Opacidad: Transparencia
- Colores: Colores diferenciados por dirección
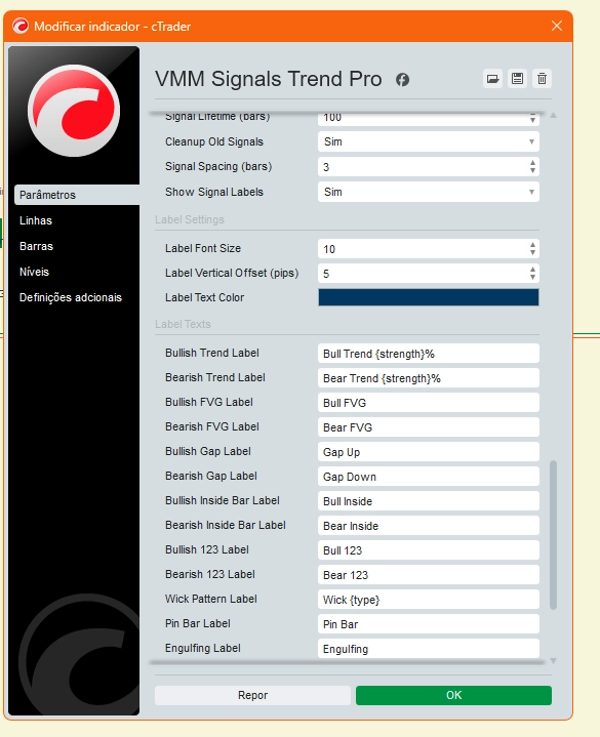
Señales:
- Duración de la Señal: Duración de la señal (en velas)
- Espaciado de Señales: Espaciado mínimo entre señales
- Máximo de Señales por Tipo: Límite por categoría
Etiquetas Personalizadas:
- Texto Personalizable: Cada patrón tiene su propio texto configurable
- Marcadores: `{strength}` para % de fuerza, `{type}` para tipo específico
- Formato: Tamaño de fuente, desplazamiento vertical, colores
- Modo Corto: Etiquetas abreviadas para gráficos densos
Mecánica Interna:
1. Análisis de Tendencia:
- Regresión Lineal: Calcula la pendiente de la tendencia
- Conteo de Velas: Alcistas vs. Bajistas en los últimos N períodos
- Momentum: Considera la magnitud de los movimientos
2. Gestión de Objetos**
- **Caché de Objetos**: Evita redibujar señales existentes
- **Limpieza Automática**: Elimina señales antiguas según su duración
- **Contadores por Tipo**: Controla la cantidad máxima
**3. **Cálculo de Fuerza**
- Cada patrón tiene una fórmula específica de fuerza
- Basado en proporciones, distancias en pips, proximidad a niveles clave
- Rango: 0-100%
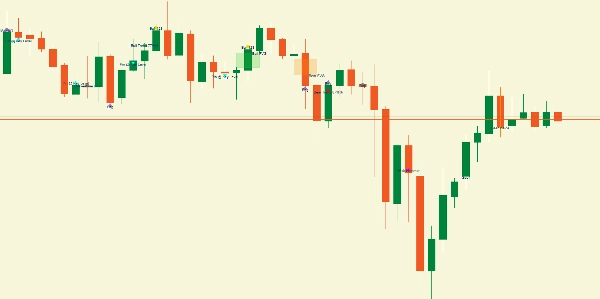
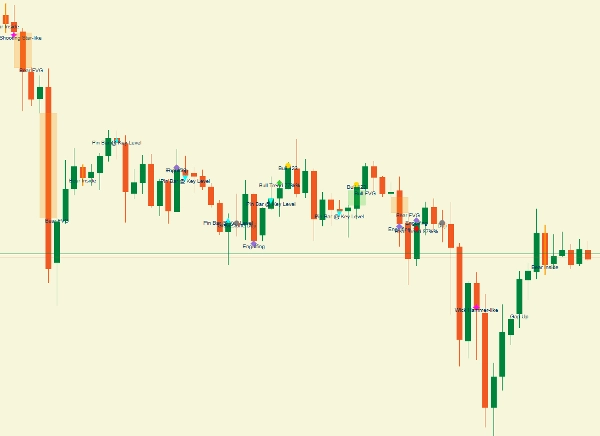
**Visualización en el Gráfico**
**Elementos del Gráfico**
1. **Iconos**: Flechas, triángulos, círculos, diamantes, estrellas
2. **Áreas**: Rectángulos semitransparentes (FVG/Gaps)
3. **Líneas**: Inside bars resaltados
4. **Etiquetas**: Texto informativo junto a las señales
**Código de Colores**
- **Verde**: Alcista (tendencia, FVG, gaps)
- **Rojo/Naranja**: Bajista (tendencia, FVG, gaps)
- **Amarillo/Naranja**: Inside bars (alcista/bajista)
- **Dorado**: patrón 123
- **Magenta**: Patrones de mecha
- **Cian**: Pin bars
- **Púrpura**: Engulfing
- **Gris**: Doji
**Ventajas**
**Para Traders**
- **Todo en uno**: Múltiples patrones en un solo indicador
- **Personalizable**: Ajuste fino de cada patrón
- **Visual claro**: Codificación de colores intuitiva
- **Filtrado**: Previene sobrecarga de señales
**Casos de Uso**
**1. Análisis Rápido**
- Identificar la tendencia predominante
- Revisar FVGs y gaps recientes
- Detectar patrones de reversión
**2. Confirmación de Entrada**
- Combinar múltiples patrones para aumentar la probabilidad
- Verificar alineación con la tendencia
- Considerar la fuerza de la señal
**3. Gestión de Riesgos**
- Identificar niveles de soporte/resistencia cercanos
- Usar FVGs como áreas de interés
- Considerar el espaciado de señales
**Limitaciones**
**Dependencias**
- **Mercados volátiles**: Puede generar muchas señales
- **Marcos temporales**: Las configuraciones pueden necesitar ajuste según el marco temporal
- **Activos**: El comportamiento varía según el par de divisas
**Consideraciones**
- **No predictivo**: Patrones pasados ≠ garantía futura
- **Confirmación requerida**: Siempre confirmar con análisis adicional
- **Señales falsas**: Los filtros reducen pero no eliminan
**Recomendaciones de Uso**
**Configuraciones Iniciales**
1. Comience con `Smart Filtering = true`
2. Ajuste `Min Signal Strength` según su estilo
3. Use `Signal Spacing` para evitar sobrecarga
4. Personalice colores para mejor visualización
**Combinaciones Efectivas**
- **Tendencia + FVG**: Alineación fuerte
- **Inside bar + Nivel clave**: Buena zona de entrada
- **Pin bar + Engulfing**: Confirmación de reversión
- **123 + Tendencia**: Probable continuación
**Monitoreo**
- Revise los registros en la consola periódicamente
- Ajuste parámetros según el mercado
- Use en conjunto con otros indicadores
Este indicador es una herramienta completa para traders que buscan un análisis técnico integral enfocado en la acción del precio y patrones visuales, ofreciendo total flexibilidad en la personalización y filtrado de señales.
**⚠️ AVISO IMPORTANTE**
Este indicador es una HERRAMIENTA DE ANÁLISIS TÉCNICO. Las señales generadas son SUGERENCIAS basadas en algoritmos, NO recomendaciones de inversión. El trading implica un riesgo significativo de pérdida. El rendimiento pasado no garantiza resultados futuros. El trader asume la RESPONSABILIDAD TOTAL de todas las decisiones de trading. Siempre use una gestión de riesgo adecuada y pruebe en cuentas demo antes de operar en vivo.


