
Descripción
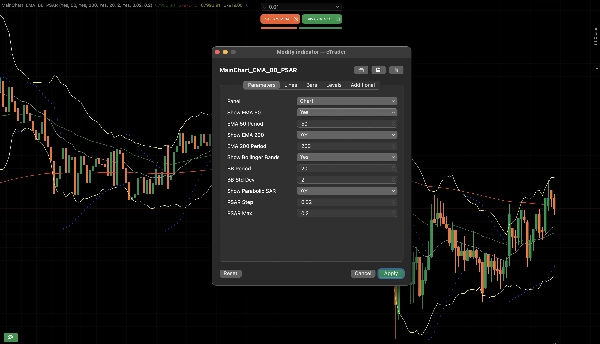
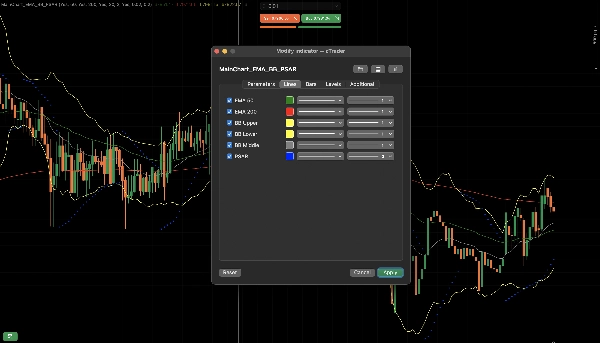
MainChart_EMA_BB_PSAR
Cómo Funciona
1. Concepto Básico
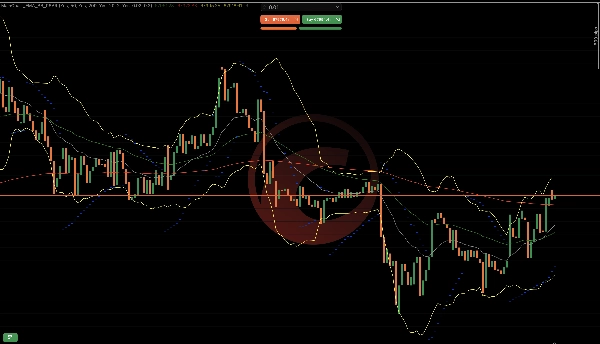
Este indicador combina la lógica de continuación de tendencia, volatilidad y momentum en una superposición:
EMA 50 & EMA 200 → Dirección de la tendencia
Bandas de Bollinger → Volatilidad y expansión
Parabolic SAR → Continuación de tendencia y momento de reversión
Cada componente cumple una función específica. Juntos, forman un marco estructurado para la toma de decisiones.
2. Lógica EMA (Motor de Tendencia)
Qué Hace
Calcula promedios exponenciales de los precios de cierre.
EMA 50 reacciona más rápido.
EMA 200 reacciona más lento.
Cómo Interpreta el Mercado
Significado de la Condición
EMA 50 por encima de EMA 200 Tendencia alcista
EMA 50 por debajo de EMA 200 Tendencia bajista
EMA 50 cruza EMA 200 Posible cambio de tendencia
Por Qué Funciona
La EMA suaviza el precio y filtra el ruido.
La relación 50/200 muestra el momentum a corto plazo relativo a la dirección a largo plazo.
3. Lógica de Bandas de Bollinger (Motor de Volatilidad)
Qué Hace
Calcula el promedio móvil (banda media)
Construye bandas superior/inferior usando desviación estándar
Cómo Interpreta el Mercado
Significado de la Condición
Bandas estrechas Baja volatilidad (compresión)
Bandas se expanden Alta volatilidad (movimiento fuerte activo)
El precio toca la banda externa Potencial sobreextensión
Por Qué Funciona
Los mercados ciclan entre compresión y expansión.
Las rupturas suelen ocurrir después de la contracción de volatilidad.
4. Lógica Parabolic SAR (Motor de Continuación)
Qué Hace
Dibuja puntos por encima o debajo del precio.
Acelera a medida que la tendencia continúa.
Cómo Interpreta el Mercado
Significado de la Posición del Punto
Debajo del precio Tendencia alcista activa
Encima del precio Tendencia bajista activa
Cambio de punto Posible reversión
Por Qué Funciona
El PSAR se ajusta a medida que la tendencia madura, ayudando a seguir movimientos y detectar agotamiento.
5. Cómo Funcionan Juntos Todos los Componentes
Estructura Alcista
EMA 50 por encima de EMA 200
Precio por encima de EMA 50
PSAR debajo de las velas
Bandas de Bollinger expandiéndose hacia arriba
→ Indica un fuerte momentum alcista
Estructura Bajista
EMA 50 por debajo de EMA 200
Precio por debajo de EMA 50
PSAR encima de las velas
Bandas de Bollinger expandiéndose hacia abajo
→ Indica un fuerte momentum bajista
6. Detección de Fase del Mercado
Este indicador ayuda a identificar 3 fases del mercado:
Fase de Tendencia
EMA alineadas
PSAR consistente
Bandas expandiéndose
Ideal para operaciones de continuación.
Fase de Compresión
Bandas estrechas
EMA plana
PSAR cambiando frecuentemente
Mejor esperar una ruptura.
Fase de Transición
Cruce de EMA formándose
Cambio de PSAR
Bandas ensanchándose
Potencial reversión temprana.
7. Ejemplo Práctico de Flujo
Ejemplo de secuencia alcista:
Compresión de bandas
Vela alcista fuerte rompe la banda superior
EMA 50 cruza por encima de EMA 200
PSAR cambia debajo del precio
Esta secuencia muestra:
Expansión de volatilidad
Confirmación de tendencia
Soporte para continuación
8. Lo Que NO Hace
No predice noticias
No garantiza reversión
No mide el flujo de órdenes
No elimina falsas rupturas
Proporciona confirmación estructurada, no certeza.
9. Modelo Resumen de Lógica
Filtro de Tendencia → EMA
Disparador de Volatilidad → Bandas de Bollinger
Temporización y Seguimiento → Parabolic SAR
Juntos, reducen entradas aleatorias y mejoran la toma de decisiones estructurada.
Lo bueno de este indicador es que es configurable y no es necesario configurar múltiples indicadores.
Resumen
1. Exponential Moving Averages (EMA 50 and EMA 200) to determine trend direction—EMA 50 reacts faster to price changes, while EMA 200 provides a longer-term trend perspective. The relative position of these EMAs signals bullish or bearish trends and potential trend shifts.
2. Bollinger Bands to measure market volatility and detect phases of compression (low volatility) and expansion (high volatility). Narrow bands indicate potential breakout setups, while price touching outer bands suggests possible overextension.
3. Parabolic SAR to identify trend continuation and reversal timing by plotting dots above or below price, signaling active uptrends or downtrends and potential reversals when dots flip position.
Together, these components form a structured decision framework that helps identify market phases—trending, compression, and transition—and supports confirmation of trend strength and momentum. The indicator is configurable and designed to reduce random entries by combining trend filtering, volatility triggers, and timing signals. It is applicable across various markets including Forex, cryptocurrencies, stocks, commodities, and indices. This tool provides structured confirmation for trading decisions but does not predict news events, guarantee reversals, or eliminate false breakouts.
Valoraciones de clientes
5 | 50 % | |
4 | 50 % | |
3 | 0 % | |
2 | 0 % | |
1 | 0 % |


