Descripción
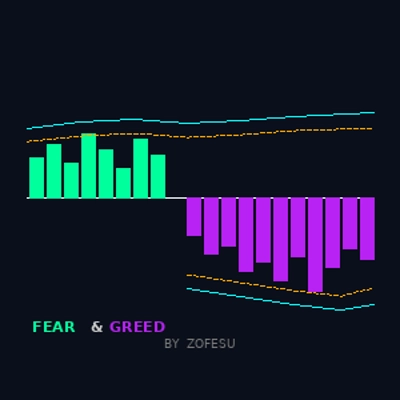
📊 Miedo y Codicia por Zofesu — Motor VIX Dual | Detección de Sentimiento Institucional
Miedo y Codicia es un oscilador de precisión construido sobre un motor dual Williams VIX Fix — uno calibrado para pánico (Miedo), otro para euforia (Codicia). Identifica momentos cuando el sobrecalentamiento institucional alcanza niveles estadísticamente extremos, señalando zonas de reversión de alta probabilidad.
⚙ CÓMO FUNCIONA
El indicador ejecuta dos cálculos WVF independientes:
Motor de Miedo — mide qué tan lejos está el mínimo actual del cierre más alto reciente. Los picos señalan capitulación y pánico.
Motor de Codicia — mide qué tan lejos está el máximo actual del mínimo más bajo reciente. Los picos señalan una sobreextensión eufórica.
Cada motor se filtra a través de dos umbrales independientes:
1. Límite superior/inferior de la Banda de Bollinger (2× Desviación Estándar)
2. Umbral de rango percentil (configurable)
Una barra de histograma aparece SÓLO cuando el precio cruza AMBOS o CUALQUIERA de los umbrales — eliminando ruido y mostrando sólo extremos estadísticamente significativos.
🔑CARACTERÍSTICAS PRINCIPALES
✅ Motor WVF dual — Miedo (Lima) y Codicia (Púrpura) calculados independientemente con ventanas de retroceso separadas
✅ Bandas BB — límites dinámicos de la Banda de Bollinger para cada motor
✅ Líneas Percentiles — umbrales de rango percentil configurables
✅ Salida limpia de histograma — barras visibles sólo en lecturas extremas
✅ Las 4 líneas límite se pueden activar/desactivar independientemente
✅ Totalmente configurable — retroceso y percentil separados para Miedo y Codicia
✅ Funciona en todos los activos y marcos temporales
✅ Ligero en C# — sin impacto en el rendimiento
📚CÓMO USAR
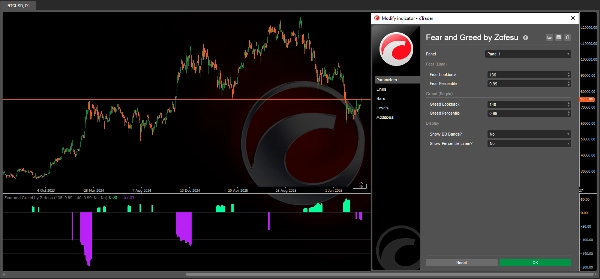
1. Añade el indicador a cualquier gráfico como un panel separado
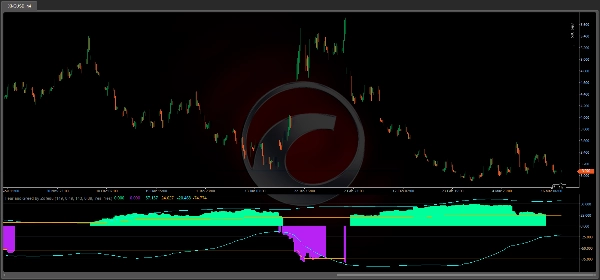
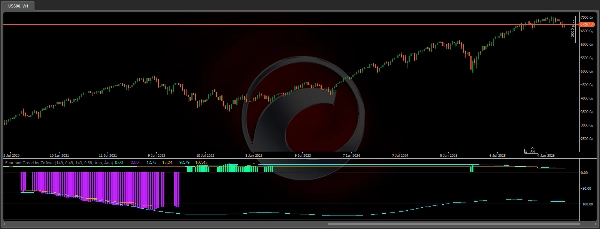
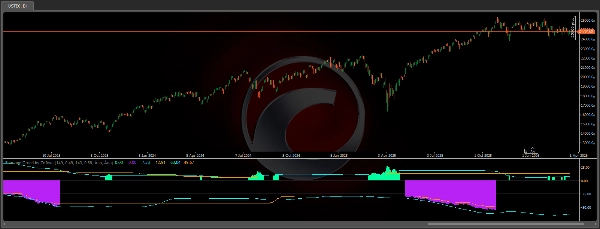
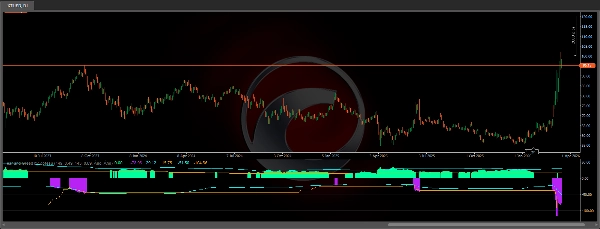
2. Histograma lima = pico de Miedo — posible zona de reversión alcista
3. Histograma púrpura = pico de Codicia — posible zona de reversión bajista
4. Líneas aqua = límites BB para cada motor
5. Líneas discontinuas naranjas = umbrales percentiles
6. Usar en confluencia con acción del precio, niveles S/R, SuperTrend o VWAP
7. Marcos temporales más altos (D1, W1) producen señales más fiables Mejores resultados en: H1, H4, D1 Funciona en: Índices (NAS100, SPX500), Cripto (BTCUSD), Forex, Oro, Petróleo, Acciones.
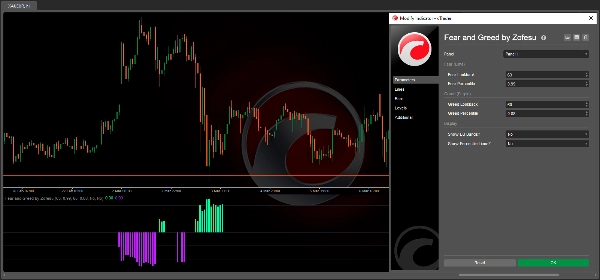
🔗PARÁMETROS
Miedo (Lima):
- Retroceso de Miedo — barras para cálculo WVF y BB (por defecto 149)
- Percentil de Miedo — umbral de rango percentil (por defecto 0,49)
Codicia (Púrpura):
- Retroceso de Codicia — barras para cálculo WVF y BB (por defecto 143)
- Percentil de Codicia — umbral de rango percentil (por defecto 0,89)
Visualización:
- Mostrar Bandas BB — activar/desactivar líneas límite aqua
- Mostrar Líneas Percentiles — activar/desactivar líneas umbral naranja
🎯 GUÍA DE CALIBRACIÓN (SEGÚN EXPERIENCIA)
Cada activo y marco temporal requiere configuraciones únicas — el indicador está diseñado para permitir esta flexibilidad.
Paso 1 — Encuentra el Retroceso adecuado:
Primero ajusta el Percentil a 0,99, luego experimenta con el valor de Retroceso entre 10 y 1000.
Un Retroceso más alto reduce el ruido pero también puede ocultar señales válidas. El rango recomendado es 50–500 para la mayoría de configuraciones.
Paso 2 — Ajusta el Percentil:
Una vez encuentres un Retroceso adecuado, reduce el Percentil gradualmente desde 0,99 hacia abajo. Esto relaja el filtro y revela señales adicionales. Los parámetros de Miedo y Codicia no necesitan coincidir.
Paso 3 — Interpretación de señales:
- La barra de Miedo desaparece en una vela cerrada → posible entrada Long en la siguiente vela.
- La barra de Codicia desaparece en una vela cerrada → posible entrada Short en la siguiente vela.
- Miedo o Codicia permanecen activos durante varias barras = el mercado está en tendencia o acumulando posiciones — no necesariamente una reversión.
- Miedo y Codicia activos simultáneamente = presión conflictiva. Primero revisa el marco temporal superior. ¿Hay un nivel clave S/R cercano? Si sí, espera confirmación antes de entrar.
La cantidad de señales depende totalmente de ti y tu estrategia — configuraciones más estrictas dan menos pero entradas de mayor calidad. Tras la configuración correcta, puedes apagar las líneas en los ajustes para que no te molesten.
⚠️ DESCARGO DE RESPONSABILIDAD Operar con instrumentos financieros implica un riesgo sustancial de pérdida. El rendimiento pasado de cualquier indicador o estrategia no garantiza resultados futuros. Esta herramienta se proporciona solo con fines informativos y educativos. Siempre utiliza una gestión de riesgo adecuada y nunca arriesgues más de lo que puedes permitirte perder. El autor no se responsabiliza por pérdidas comerciales derivadas del uso de este indicador.
Resumen
Valoraciones de clientes
5 | 0 % | |
4 | 100 % | |
3 | 0 % | |
2 | 0 % | |
1 | 0 % |


