present
Registrieren Sie sich und erhalten Sie $50 Rabatt auf Ihren ersten Kauf
Trading product for AW Multi Data Indikator, image 1
AW Multi Data
5.62K
Kostenlose Installationen

Beschreibung

Zusammenfassung

KI-Zusammenfassung
AW Multi Data is a trading indicator that displays key trading metrics directly on your chart. It shows the current symbol and timeframe, daily net profit percentage, daily net profit amount, and spread. The indicator requires the timezone to be set to UTC to accurately reflect daily profit values. This tool provides real-time performance data to assist traders in monitoring their trades within the charting interface.
Indikatorprofil

Diskussion

Kundenbewertungen

0.0
Bewertungen: 0
Kundenbewertungen
Bisher gibt es keine Bewertungen für dieses Produkt. Haben Sie es schon ausprobiert? Dann können Sie die erste Person sein, die andere darüber informiert!

Häufig gestellte Fragen (FAQ)

Über den cTrader Store verfügbare Produkte, einschließlich Handelsbots, Indikatoren und Plugins, werden von externen Entwicklern bereitgestellt und nur zu Informations- und technischen Zugriffszwecken verfügbar gemacht. cTrader Store ist kein Broker und erbringt keine Anlageberatung, persönlichen Empfehlungen oder eine Garantie für zukünftige Performance.

Mehr von diesem Autor

with this indicator you could see other time frame candle in your chart.
show spread on chart
some user add moving average to macd to see better. in ctrader 4.3.11 there is a problem with this . I make a macd tha
this indicator show macd on chart.
Multi Time Frame Moving Average is a powerful and flexible indicator for cTrader
 this moving include everything that a trader needs from Moving Average.
this indicaotr show distance between Tenkan to Kijun, Close to Kijun and Close to Tenkan 
Add Slowing to IR Moving Average.
IR Candle Open plots customizable opening price lines for daily, weekly, and monthly candles
Coral indicator
you could put your check list in your chart you could split your test with “,” you could put your checklist in indicat
this indicator show other time frame close in lower time frame. for ex: show daily close in m 15.

Das könnte Sie auch noch interessieren

🌊 See when the market is truly in play. Tsunami measures Relative Volume by time-of-day 🌊
Automatic ZigZag swings with dynamic support & resistance levels, labeling highs/lows for clear trend signals.
Easy Trade: Trend & Breakout Indicator for cTrader
BoS ChoCH Pro,Strict Mode,False Breakout Filter,Average hit rate: 72-78%
Smart Money Concepts (SMC) indicator with real-time Fair Value Gap (FVG) boxes, $50 round numbers, and live market HUD.
This is an indicator that displays candlesticks from different timeframes. This is the demo version with a 30-day expira
Trade With Smile Indicator is a professional trading indicator designed to help traders identify potential market trends
Trading.FC$_vwap Algo shows VWAP trends, dynamic support/resistance and deviation bands to spot potential trade entries.
LevelMaster S/R: Pinpoint key support & resistance zones with precision. Perfect for traders of all levels Trade smarter
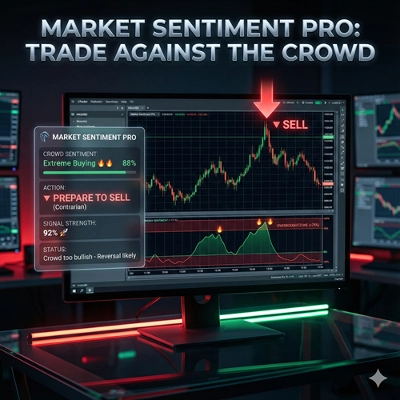
Market Sentiment Pro: Predict tops & bottoms using crowd psychology. Contrarian signals with 70-80% accuracy. Early Acce
Smart Money Gaps: MTF FVG auto-detection, extension, and mitigation marker. Trade institutional imbalances.
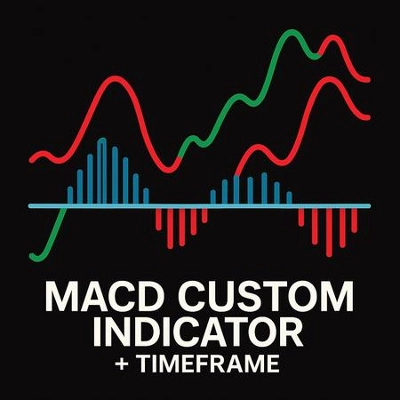
MacD Custom Indicator-Multiple Time Frame
Trend direction, chart signals, reversal zones and volume tools in one configurable indicator.
Trade fearlessly: auto-adjusts order blocks, manages risks, and ensures precision. Free for early users.
Perfect Trend
buy and sell
AI-powered daily range forecasts help traders spot volatility opportunities and plan stops and targets.
Multi-timeframe trend indicator using EMA, MACD & ADX to confirm high-probability buy and sell bias.

Preis

5.62K
Kostenlose Installationen