
Descripción
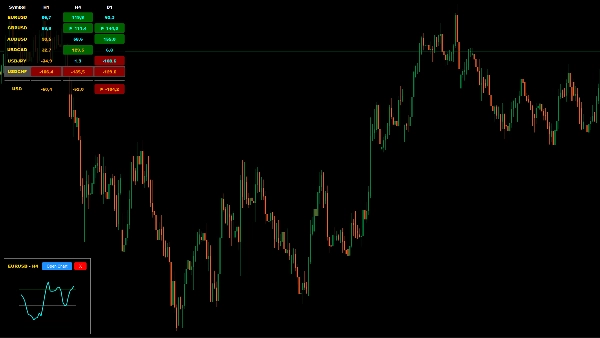
El Escáner HIO Multi-Moneda CCI es un indicador personalizado de cTrader diseñado para optimizar tu espacio de trabajo de trading. En lugar de navegar entre múltiples gráficos abiertos, este indicador proporciona un panel centralizado para monitorear los valores del Índice de Canal de Mercancías (CCI) a través de múltiples símbolos y marcos temporales simultáneamente. Está construido para ayudar a los traders a identificar posibles extremos del mercado y continuaciones de tendencia desde un solo panel.
Características clave
- Matriz Multi-Símbolo y Marco Temporal: Monitorea símbolos y marcos temporales definidos por el usuario dentro de un solo panel unificado en tu gráfico de cTrader.
- Cálculo de la Fortaleza de la Moneda: Cuenta con un medidor integrado que estima la fortaleza de la moneda objetivo usando un algoritmo CCI ponderado por volumen.
- Mini-Gráficos Interactivos: Haz clic en cualquier celda de datos dentro del panel para abrir un mini-gráfico flotante, permitiéndote ver la línea detallada del CCI sin salir de tu espacio de trabajo principal.
- Alertas Integradas de Telegram: Conecta tu Bot de Telegram para recibir notificaciones cuando marcos temporales individuales—o una confluencia de todos los marcos temporales—entren o salgan de tus zonas extremas predefinidas.
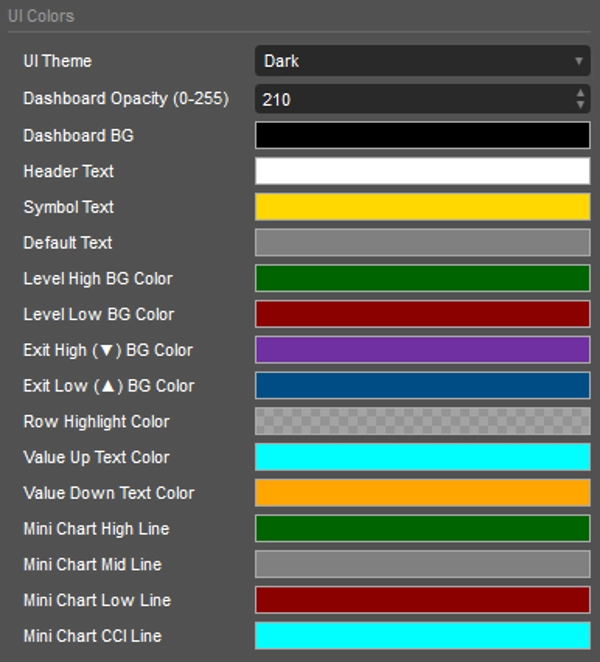
- Interfaz Personalizable: Diseño totalmente adaptable con temas de color Claro, Oscuro o Personalizado para integrarse perfectamente con tu entorno preferido de cTrader.
Configuración y Parámetros
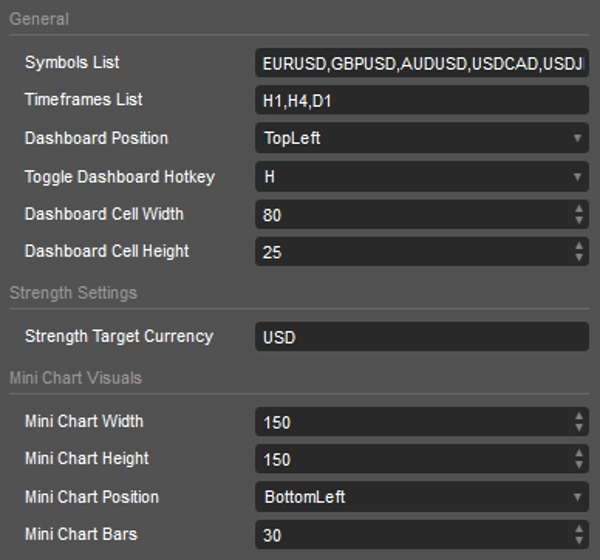
- Símbolos y Marcos Temporales: Ingresa tus activos y marcos temporales deseados usando valores separados por comas (por ejemplo, EURUSD, GBPUSD y h1, h4, d1).
- Moneda Objetivo: Define la moneda base (por ejemplo, USD) para los cálculos del medidor de fortaleza.
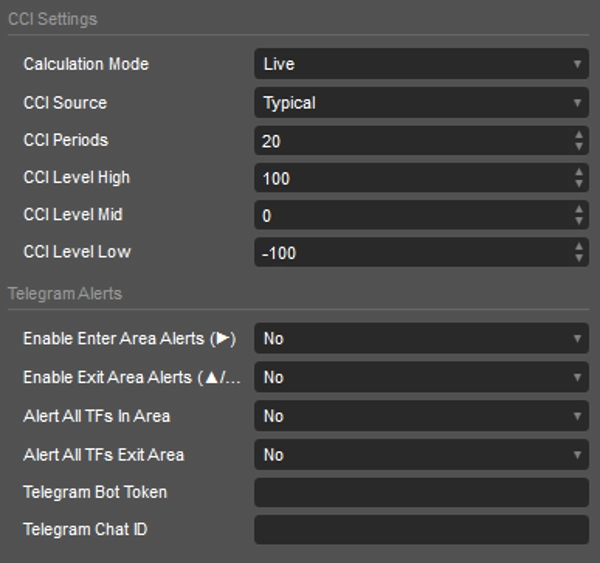
- Configuración del CCI: Personaliza los parámetros principales incluyendo el Modo de Cálculo (En Vivo/Cierre de Barra), Fuente de Datos (por ejemplo, Cierre, Máximo, Mínimo), Períodos y umbrales específicos de Sobrecompra/Sobreventa.
- Configuración de Alertas: Ingresa el Token de tu Bot de Telegram y el ID de Chat para habilitar notificaciones push remotas.
Leyenda del Panel (Colores y Símbolos)
El panel utiliza señales visuales para transmitir rápidamente datos de momentum:
- Fondo Verde Oscuro: El CCI se encuentra actualmente en la zona de Sobrecompra.
- Fondo Rojo Oscuro: El CCI se encuentra actualmente en la zona de Sobreventa.
- Fondos Morado/Azul: El CCI está cruzando activamente hacia fuera de una zona extrema.
- ▶ (Entrada): El momentum está entrando activamente en un umbral extremo.
- ▼ (Bajar/Salida): Saliendo del área de Sobrecompra, indicando un posible momentum a la baja.
- ▲ (Subir/Salida): Saliendo del área de Sobreventa, indicando un posible momentum al alza.
Nota: Esta herramienta está diseñada con fines analíticos para asistir en tu flujo de trabajo de análisis técnico dentro de cTrader.
Resumen
Valoraciones de clientes
5 | 50 % | |
4 | 50 % | |
3 | 0 % | |
2 | 0 % | |
1 | 0 % |


![Logotipo de "Gaussian Channel [Iridio Capital]"](https://cdn.ctrader.com/image/webp/7c039209-5573-4a54-a072-f9528b503103_41960)


