
HIO Mutil Currency Stochastic Scanner
インジケーター
バージョン 1.1、May 2026
Windows、Mac
4.5
レビュー: 2
説明
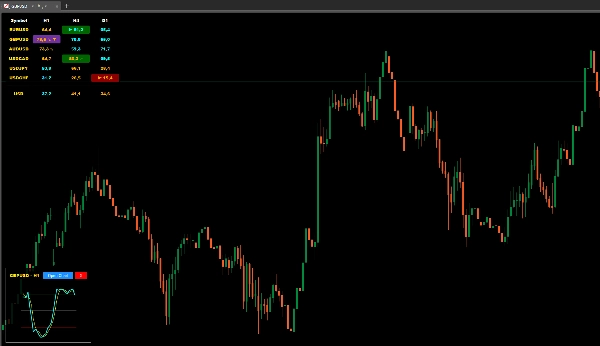
HIOマルチ通貨ストキャスティクススキャナーは、市場分析を効率化するために設計された高度なダッシュボードインジケーターです。何十ものチャートを開く代わりに、このツールは単一のパネルから複数のシンボルとタイムフレームにわたるストキャスティクスオシレーターを同時に監視できます。トレーダーが潜在的な市場状況を効率的に特定するのを支援し、時間を節約し作業スペースを整理された状態に保ちます。
主な特徴
- マルチシンボル&タイムフレーム監視: 選択したタイムフレームにわたって何十もの通貨ペアを1つのクリーングリッドで追跡します。
- インタラクティブミニチャート: 任意のセルをクリックするとポップアップミニチャートが開き、現在のチャートを離れることなくストキャスティクスラインとK/Dクロスを即座に視覚化できます。
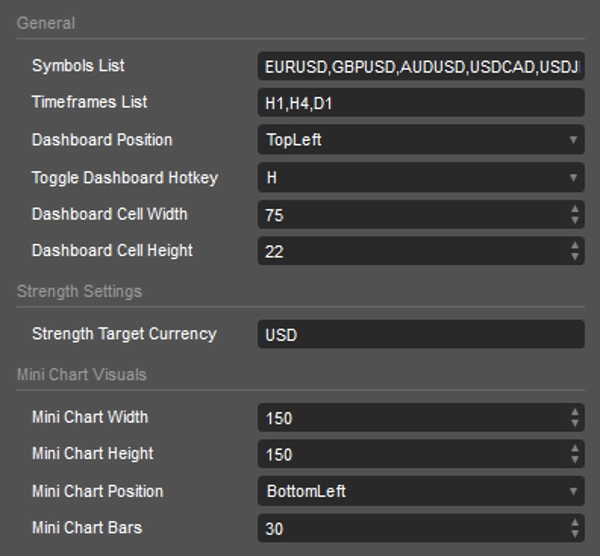
- 通貨強度メーター: ストキャスティクスとボリュームデータに基づいてターゲット通貨(例:USD)の加重強度を計算する専用行を備えています。
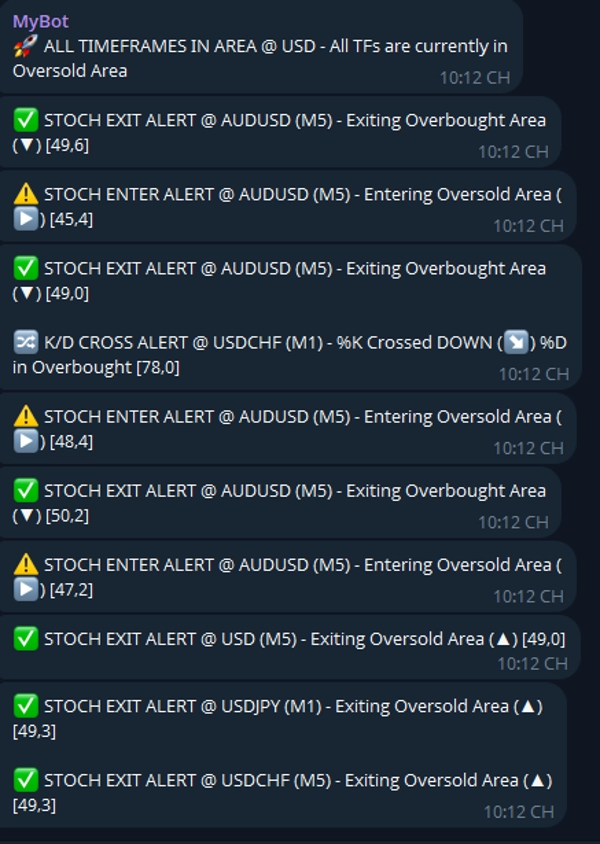
- 包括的なアラート: 買われ過ぎ(OB)および売られ過ぎ(OS)エリアへの出入りやK/Dクロスオーバーに関するTelegram通知をサポートします。
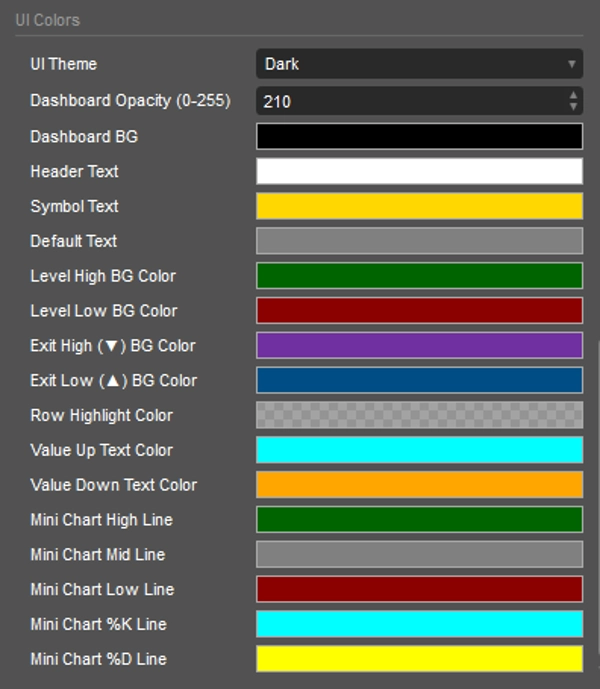
- カスタマイズ可能なUI: ダーク、ライト、またはカスタムテーマから選択可能。ホットキーでダッシュボードの表示を即座に切り替えられます。
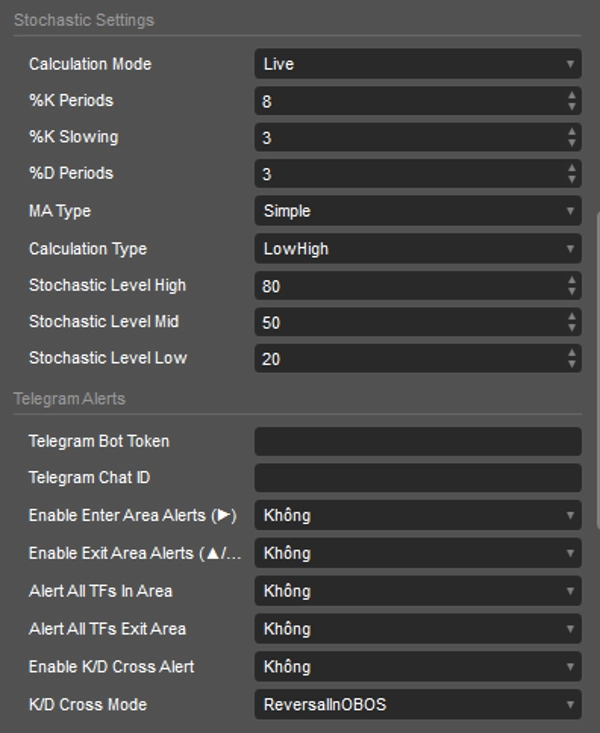
セットアップ&パラメーター
- 一般:
Symbols List(カンマ区切り)とTimeframes Listを定義します。Toggle Dashboard Hotkey(デフォルトは「H」)を設定します。 - ストキャスティクス設定:
%K Periods、%K Slowing、%D Periods、およびMA Typeを完全にカスタマイズして戦略に合わせます。Stochastic Level HighおよびStochastic Level LowでOB/OSの限界を調整します。 - Telegramアラート:
Telegram Bot TokenとChat IDを入力します。エリアの出入りやK/Dクロスモード(反転、継続、中立ゾーンなど)などの特定のアラートトリガーを切り替えます。
シンボル&色の説明
- 色:
-
- ダークグリーンの背景: シンボルは買われ過ぎエリアにあります。
- ダークレッドの背景: シンボルは売られ過ぎエリアにあります。
- アクア / オレンジのテキスト: ストキャスティクス値が現在上昇中(アクア)か下降中(オレンジ)かを示します。
- シンボル:
-
- ▶ (エントリー): 価格が買われ過ぎまたは売られ過ぎゾーンに入っています。
- ▲ (売られ過ぎゾーンからの上抜け): 価格が売られ過ぎゾーンを上方に抜けています。
- ▼ (買われ過ぎゾーンからの下抜け): 価格が買われ過ぎゾーンを下方に抜けています。
- ↗ (クロスアップ): %Kラインが%Dラインを上抜けしました。
- ↘ (クロスダウン): %Kラインが%Dラインを下抜けしました。
HIOマルチ通貨ストキャスティクススキャナーは、テクニカルトレーダーのための強力なワークフロー向上ツールです。重要なモメンタムデータを集中管理することで、市場のより明確なマクロ視点を提供し、チャートの混雑なしに情報に基づいた意思決定を支援します。
概要
インジケーターのプロフィール
インジケーターのカテゴリー
モメンタム
出力の種類
ビジュアル表示
シグナル
フィルター
データ要件
バーのみ
ティックデータ
取引高
サポート対象のシグナル
クロス
反転
ボラティリティ
トレンドの強さ
ダイバージェンス
ラインブレイク
ラインタッチ
カスタマーレビュー
4.5
レビュー: 2
5 | 50 % | |
4 | 50 % | |
3 | 0 % | |
2 | 0 % | |
1 | 0 % |
カスタマーレビュー
May 20, 2026
a calm trader gets value from timing feels less random, and two sessions say more than one clean chart.
May 17, 2026
A 5 minute check should not become a 30 minute rabbit hole. It supports the idea without replacing judgment.
ディスカッション
よくあるご質問
Volume
Stochastic
cTrader Storeで入手可能な取引ボット、インジケーター、プラグインなどの商品は、第三者の開発者が提供するものであり、情報と技術の取得のみを目的としてご利用いただけます。cTrader Storeはブローカーではなく、投資助言や個人的な推奨を行うことも、将来のパフォーマンスを保証することもありません。
この作成者の他の商品


価格
登録日 12/06/2025
1
販売
316
無料インストール