
(ViPi) MTF Candles
Indicador
106 descargas
Versión 1.0, Feb 2026
Windows, Mac
Descripción
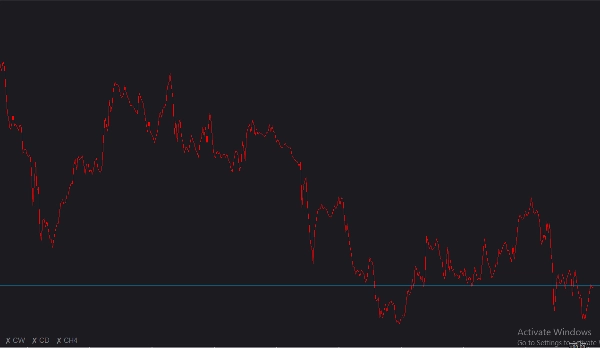
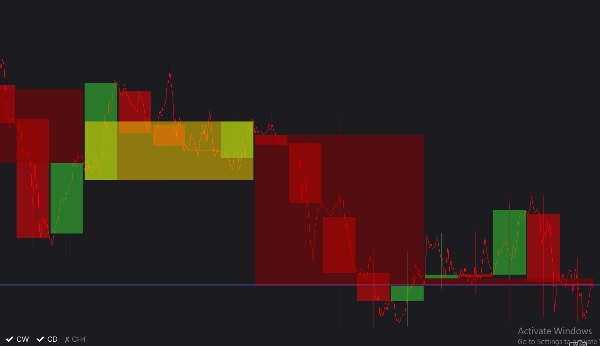
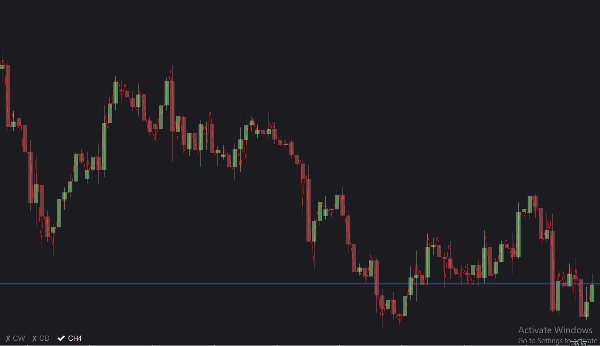
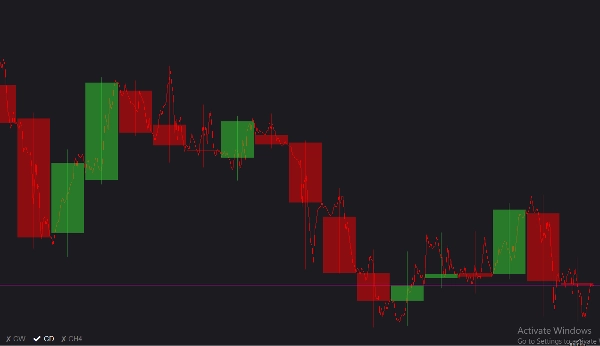
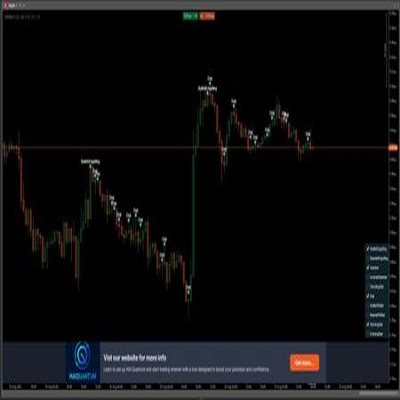
Introducción Detallada (ViPi) MTF Candles es una herramienta de gráficos altamente interactiva y personalizable diseñada para ofrecer a los traders una perspectiva del mercado de arriba hacia abajo sin salir de su gráfico activo. Al superponer sin problemas hasta tres velas de marco temporal superior (MTF) distintas directamente en su vista actual, puede identificar fácilmente tendencias macroeconómicas, niveles clave de soporte/resistencia y cambios en el mercado de un vistazo. Cuenta con un elegante menú de alternancia en el gráfico, no intrusivo, que le permite ocultar o mostrar instantáneamente cada marco temporal, asegurando que su espacio de trabajo permanezca limpio y enfocado.
Lista Completa de Parámetros
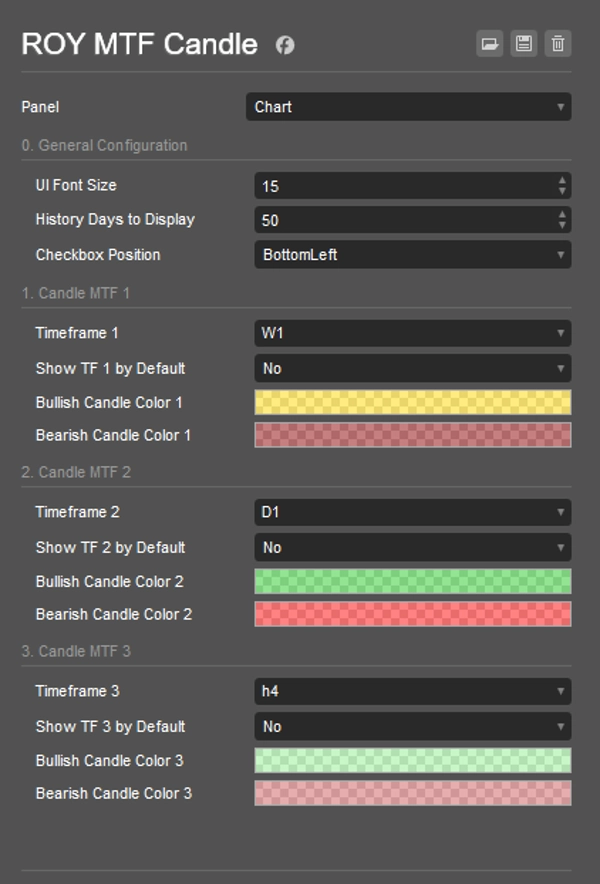
- Tamaño de Fuente de la IU: Ajusta el tamaño del texto para los botones interactivos de alternancia en el gráfico. Puede configurarse entre 8 y 30 (Predeterminado: 11).
- Días de Historial a Mostrar: Determina cuántos días hacia atrás el indicador dibujará las velas MTF históricas (Predeterminado: 50 días).
- Posición de la Casilla de Verificación: Le permite anclar el menú de alternancia de la IU a cualquier esquina de su gráfico: SuperiorIzquierda, SuperiorDerecha, InferiorIzquierda o InferiorDerecha (Predeterminado: InferiorIzquierda).
- Marco Temporal 1, 2, 3: Los marcos temporales superiores específicos que desea monitorear. (Los valores predeterminados son Semanal, Diario y Hora4 respectivamente).
- Mostrar TF 1, 2, 3 por Defecto: Alterna si las velas de cada marco temporal son visibles inmediatamente cuando se aplica el indicador al gráfico (Predeterminado: Falso).
- Colores de Velas Alcistas/Bajistas: Permite la personalización completa de los colores de las velas alcistas y bajistas para cada uno de los tres marcos temporales, con soporte de transparencia para evitar oscurecer su gráfico principal.
Guía de Uso
- Adjuntar al Gráfico: Cargue el indicador (ViPi) MTF Candles en su espacio de trabajo activo de cTrader.
- Configurar Marcos Temporales: Abra la configuración y seleccione hasta tres marcos temporales macro (por ejemplo, Semanal, Diario y H4) que desea monitorear junto con su marco temporal actual.
- Personalizar Visuales: Ajuste los colores y la transparencia de las velas alcistas y bajistas de cada marco temporal para que contrasten bien con su fondo.
- Alternar Visibilidad al Instante: Use los convenientes botones interactivos en el gráfico (ubicados en la Posición de Casilla de Verificación que eligió) para hacer clic rápidamente y alternar superposiciones MTF específicas activadas o desactivadas mientras realiza su análisis.
Resumen
Resumen de IA
(ViPi) MTF Candles is a charting indicator for cTrader that overlays up to three higher timeframe (multi-timeframe, MTF) candlestick charts directly onto the current chart. This tool enables traders to analyze broader market trends, key support and resistance levels, and shifts in market sentiment without switching charts. Users can customize the displayed timeframes—commonly Weekly, Daily, and 4-hour—and adjust the number of historical days shown. The indicator includes an on-chart toggle menu, which can be positioned in any corner of the chart, allowing quick visibility control of each timeframe overlay. Visual customization options include adjustable font sizes for toggle buttons and configurable bullish/bearish candle colors with transparency settings to maintain chart clarity. This facilitates a streamlined, interactive top-down market perspective suitable for various markets including Forex, indices, commodities, stocks, and cryptocurrencies.
Perfil del indicador
Valoraciones de clientes
0.0
Valoraciones: 0
Valoraciones de clientes
Este producto todavía no se ha valorado. ¿Ya lo ha probado? Sea el primero en informar a otros.
Conversación
Preguntas frecuentes
BTCUSD
Forex
Indices
EURUSD
Commodities
GBPUSD
NZDUSD
Crypto
Stocks
XAUUSD
NAS100
USDJPY
Los productos disponibles a través de cTrader Store, incluidos bots, indicadores y plugins para operar, son proporcionados por desarrolladores de terceros y están disponibles únicamente con fines informativos y de acceso técnico. cTrader Store no es un bróker, por lo que no proporciona asesoramiento de inversión, recomendaciones personales ni ninguna garantía de rentabilidad futura.
Más de este autor


Precio
Desde 12/06/2025
1
Ventas
336
Instalaciones gratis