
Descripción
Niveles de Números Redondos - Indicador para cTrader
Descripción
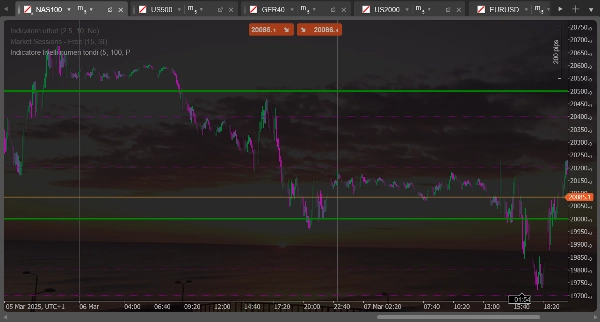
Este indicador dibuja líneas horizontales en "números redondos" o niveles psicológicamente significativos en el gráfico. Es ideal para identificar posibles áreas de soporte y resistencia basadas en niveles de precio redondos que a menudo tienen importancia psicológica para los traders.
Funciones principales
- Dibuja dos conjuntos distintos de líneas horizontales a intervalos regulares
- Calcula automáticamente los niveles basándose en el precio de cierre actual
- Se actualiza dinámicamente conforme se mueve el precio
- Ofrece configuración separada para cada conjunto de líneas (color, estilo, tamaño)
Ajustes posibles
Para el primer conjunto de líneas (discontinuas)
- Número de Líneas Conjunto 1: Determina cuántas líneas dibujar por encima y por debajo del precio actual (predeterminado: 5)
- Tamaño del Rango Conjunto 1: Establece la distancia entre las líneas en pips (predeterminado: 100 pips)
- Color de Líneas Conjunto 1: Personaliza el color de las líneas (predeterminado: púrpura)
- Grosor de Líneas Conjunto 1: Establece el grosor de las líneas (predeterminado: 1 píxel)
Para el segundo conjunto de líneas (continuas)
- Número de Líneas Conjunto 2: Determina cuántas líneas dibujar por encima y por debajo del precio actual (predeterminado: 2)
- Tamaño del Rango Conjunto 2: Establece la distancia entre las líneas en pips (predeterminado: 500 pips)
- Color de Líneas Conjunto 2: Personaliza el color de las líneas (predeterminado: verde)
- Grosor de Líneas Conjunto 2: Establece el grosor de las líneas (predeterminado: 1 píxel)
Uso práctico
Típicamente, el primer conjunto (líneas discontinuas) se usa para identificar niveles psicológicos menores, mientras que el segundo conjunto (líneas continuas) resalta niveles psicológicos mayores. Por ejemplo, para EURUSD podrías configurar el primer conjunto para mostrar niveles cada 100 pips (como 1.0800, 1.0900) y el segundo conjunto para niveles cada 500 pips (como 1.0500, 1.1000).
Estos niveles a menudo coinciden con zonas de soporte o resistencia donde el precio podría rebotar o desacelerar antes de continuar su movimiento.
Round Number Levels - Indicator for cTrader
Description
This indicator draws horizontal lines at "round numbers" or psychologically significant levels on the chart. It's ideal for identifying potential support and resistance areas based on round price levels that often have psychological importance for traders.
Main Features
- Draws two distinct sets of horizontal lines at regular intervals
- Automatically calculates levels based on the current closing price
- Updates dynamically as price moves
- Offers separate configuration for each set of lines (color, style, size)
Possible Adjustments
For the first set of lines (dashed)
- Number of Lines Set 1: Determines how many lines to draw above and below the current price (default: 5)
- Range Size Set 1: Sets the distance between lines in pips (default: 100 pips)
- Line Color Set 1: Customizes the color of the lines (default: purple)
- Line Width Set 1: Sets the thickness of the lines (default: 1 pixel)
For the second set of lines (solid)
- Number of Lines Set 2: Determines how many lines to draw above and below the current price (default: 2)
- Range Size Set 2: Sets the distance between lines in pips (default: 500 pips)
- Line Color Set 2: Customizes the color of the lines (default: green)
- Line Width Set 2: Sets the thickness of the lines (default: 1 pixel)
Practical Usage
Typically, the first set (dashed lines) is used to identify minor psychological levels, while the second set (solid lines) highlights major psychological levels. For example, for EURUSD, you might set the first set to show levels every 100 pips (such as 1.0800, 1.0900) and the second set for levels every 500 pips (such as 1.0500, 1.1000).
These levels often coincide with support or resistance zones where price might bounce or slow down before continuing its movement.
Resumen
Valoraciones de clientes
5 | 50 % | |
4 | 50 % | |
3 | 0 % | |
2 | 0 % | |
1 | 0 % |


