
DynamicVolumeSupplyDemand
Indicador
1.29K descargas
Versión 1.0, Apr 2025
Windows, Mac
4.2
Valoraciones: 5
Descripción
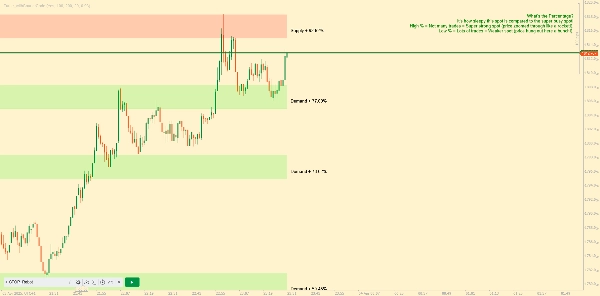
Presentando las Zonas Dinámicas de Oferta y Demanda de AlgoAlpha recreadas por mí para la Plataforma Ctrader. Este indicador está diseñado para identificar y visualizar automáticamente zonas dinámicas de oferta y demanda en tu gráfico, ayudando a los traders a localizar posibles áreas de reversión y evaluar el sentimiento del mercado con mayor claridad. Se adapta a las condiciones del mercado utilizando un mecanismo dinámico de retroceso, haciéndolo más sensible a los movimientos recientes del precio. 📈💡
Características Clave
- 📊 Retroceso Dinámico: Ajusta automáticamente el período de retroceso basado en el punto pivote más reciente, asegurando que se analicen los datos más relevantes.
- 🎯 Detección de Puntos Pivote: Utiliza un período definido por el usuario para detectar pivotes altos y bajos significativos, marcando con precisión posibles puntos de reversión.
- 🛠 Parámetros Personalizables: Ofrece amplias opciones de personalización incluyendo período de retroceso, sensibilidad de detección de pivotes, resolución y tolerancia de zona.
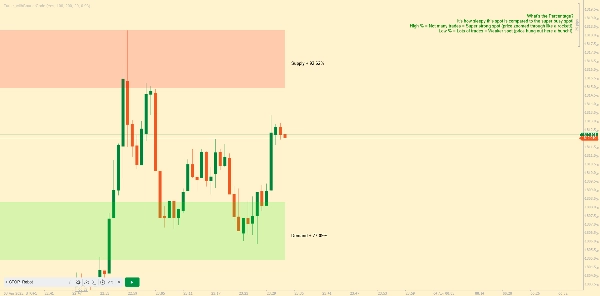
- 🗺 Visualización: Muestra las zonas de oferta y demanda como cuadros en el gráfico, con resaltado de fondo para diferenciar entre zonas alcistas y bajistas.
- 🖍 Zonas Codificadas por Color: Las zonas están codificadas por colores para fácil identificación: verde para alcistas, rojo para bajistas y gris para niveles neutrales.
Resumen
Resumen de IA
DynamicVolumeSupplyDemand is an indicator for the cTrader platform that automatically identifies and visualizes dynamic supply and demand zones on trading charts. It helps traders locate potential reversal areas and evaluate market sentiment by adapting to recent price movements through a dynamic look-back mechanism. Key features include:
- Dynamic Look-Back: Automatically adjusts the look-back period based on the latest pivot points to analyze the most relevant data.
- Pivot Point Detection: Uses a user-defined period to detect significant pivot highs and lows, marking potential reversal points.
- Customizable Parameters: Allows adjustment of look-back period, pivot detection sensitivity, resolution, and zone tolerance.
- Visual Display: Presents supply and demand zones as boxes on the chart with background highlighting to distinguish bullish and bearish zones.
- Color-Coded Zones: Zones are color-coded for clarity—green for bullish, red for bearish, and gray for neutral levels.
This indicator supports enhanced clarity in market analysis by dynamically adapting to changing market conditions and providing clear visual cues for supply and demand levels.
Perfil del indicador
Valoraciones de clientes
4.2
Valoraciones: 5
5 | 40 % | |
4 | 40 % | |
3 | 20 % | |
2 | 0 % | |
1 | 0 % |
Valoraciones de clientes
October 12, 2025
Could you please make a new indicator so too remove the explanation and how the indicator works written on the chart? Very nice indicator otherwise!
August 12, 2025
Pros: Identifies dynamic supply and demand zones based on volume. Flexible settings, strong visual clarity. Cons: No alerts or tooltips. Lacks history of previous zones and user template saving.
May 15, 2025
This indicator finds the supply and demand areas very well but it has a problem. But the explanation and how the indicator works written on the chart is very annoying. I hope the designer of this software will solve this problem. Thank you
Conversación
Preguntas frecuentes
Los productos disponibles a través de cTrader Store, incluidos bots, indicadores y plugins para operar, son proporcionados por desarrolladores de terceros y están disponibles únicamente con fines informativos y de acceso técnico. cTrader Store no es un bróker, por lo que no proporciona asesoramiento de inversión, recomendaciones personales ni ninguna garantía de rentabilidad futura.


Precio
Desde 09/01/2025
11.78K
Instalaciones gratis