
US30 and Dow Jones Trading Robots
Find US30 and Dow Jones trading robots for cTrader designed for the US30 index (Wall Street 30 / DJIA). These cBots target breakouts, momentum and intraday swings with built-in stop and target logic for the index's sharp moves. Compare best, free and premium US30 robots for automated index trading on cTrader.
Outils
Symboles négociables
Bots les plus performants
Comparaison d'outils
Questions fréquentes
Outils


Symboles négociables
Les produits de cette collection prennent en charge les symboles suivants :
US30
DJIA
La disponibilité des symboles et leurs suffixes dépendent de votre courtier.
Bots les plus performants
Comparaison d'outils
Produit | Avis | Téléchargements | Ventes | ROI | Prix |
|---|---|---|---|---|---|
ALPHA RAZER US30 v3.0 | 4.8 (4) | — | 5 | 27038.9% | à partir de 50 $ |
US30_Trading_Robot | — | — | 2 | 25.6% | $80 |
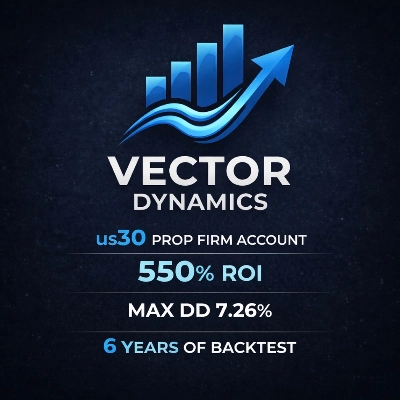
Prop_Firm_Us30 | — | — | 1 | — | $199 |
Quantum_us30pepper | 5.0 (3) | — | — | — | $300 |
Questions fréquentes
The Dow Jones Industrial Average is a price-weighted index of a small group of large US companies, and brokers often list its CFD as US30. Other labels include DJ30 and WallSt30, and a cBot coded for it automates breakout, momentum or intraday rules under your settings.
In a price-weighted index, shares with high prices move the average most, so news from a single company can swing it noticeably. The index level is also high, so moves look large in points, and a stop that seems wide in points can still be tight relative to a normal day's range.
It should allow for wide intraday ranges and the burst at the New York open, for example by sizing stops with ATR instead of fixed points. Compare how each bot places targets, whether it trails, and its tested drawdown; a trial, where offered, lets you check this on your own data.
Yes. Sudden moves on economic data or company news can push the index through stops, and history rarely contains every shock, so live drawdown can go deeper than any backtest. Size positions for that possibility rather than for the tested figure.
Add the built-in Momentum Oscillator or RSI to a US30 chart to see the readings a bot's rules may use. Then backtest the bot on desktop and compare those readings with its trades, which shows whether entries match the description.