
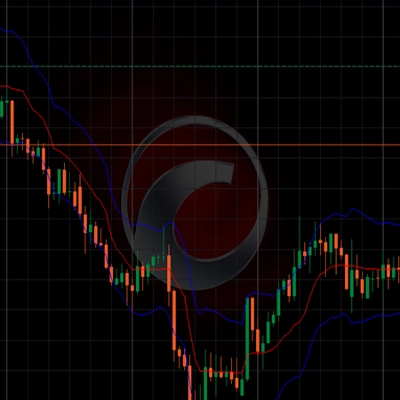
KAMAKeltner
Indicateur
Version 1.0, May 2025
Windows, Mac
4.3
Avis : 3

Depuis le 02/02/2025
1
Ventes
Description
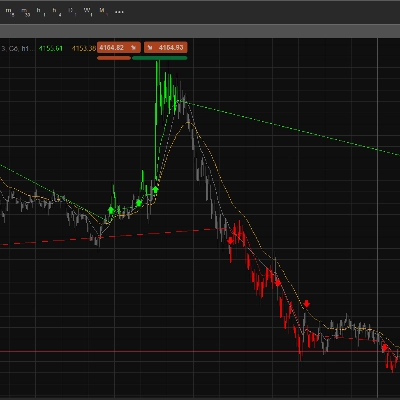
KAMA Keltner combine la puissance de la moyenne mobile adaptative de Kaufman (KAMA) avec la dynamique éprouvée des canaux de Keltner, créant une bande de volatilité réactive et auto-ajustable qui s’adapte aux conditions du marché en temps réel.
Contrairement aux canaux traditionnels, cette version réagit plus rapidement aux changements de tendance tout en filtrant le bruit, grâce à son moteur de lissage adaptatif. Idéal pour :
- Stratégies de retour à la moyenne – définit précisément les zones de surachat/survente
- Systèmes de cassure – s’adapte dynamiquement aux expansions de volatilité
- Entrées et sorties suivant la tendance – signaux clairs dans les environnements en range et en tendance
Conçu pour les traders qui exigent précision, adaptabilité et rapidité – que vous fassiez du scalping, du swing trading ou que vous utilisiez des modèles algorithmiques.
Résumé
Résumé IA
KAMA Keltner is a technical indicator that integrates Kaufman's Adaptive Moving Average (KAMA) with Keltner Channels to form a responsive, self-adjusting volatility band. This adaptive channel adjusts dynamically to real-time market conditions, providing faster reaction to trend changes while filtering out market noise through its smoothing engine. It is designed to support various trading strategies, including mean reversion by identifying overbought and oversold zones, breakout systems by adapting to volatility expansions, and trend-following entries and exits with clear signals in both ranging and trending markets. The indicator is suitable for traders employing scalping, swing trading, or algorithmic models who require accuracy, adaptability, and speed in their analysis.
Profil de l'indicateur
Discussion
Avis clients
4.3
Avis : 3
5 | 33 % | |
4 | 67 % | |
3 | 0 % | |
2 | 0 % | |
1 | 0 % |
Avis clients
May 18, 2025
It supports the plan without acting like the plan, but the first run should stay small enough to be boring.
May 14, 2025
May 11, 2025
Pretty decent as a backup check, especially in trend days. The result needs a journal.
Questions fréquentes
Breakout
Scalping
Les produits disponibles sur cTrader Store, notamment les bots de trading, les indicateurs et les plug-ins, sont fournis par des développeurs tiers et mis à disposition à titre informatif et à des fins d'accès technique uniquement. cTrader Store n'est pas un courtier et ne fournit aucun conseil en investissement, aucune recommandation personnelle ni aucune garantie quant aux performances futures.
Plus de cet auteur




Prix
Depuis le 02/02/2025
1
Ventes