
MultiMAIndicator_Optimized
Indicateur
1 achats
Version 1.0, Jun 2025
Windows, Mac
4.0
Avis : 4
Depuis le 03/04/2025
1.71B
Volume tradé
556.96K
Pips gagnés
1
Ventes
Description
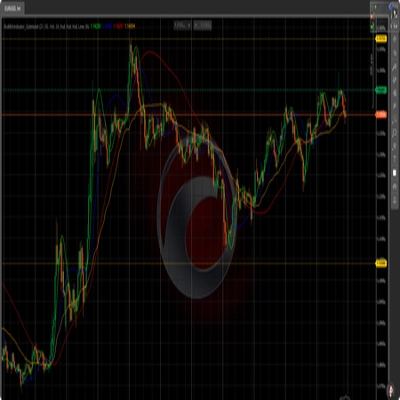
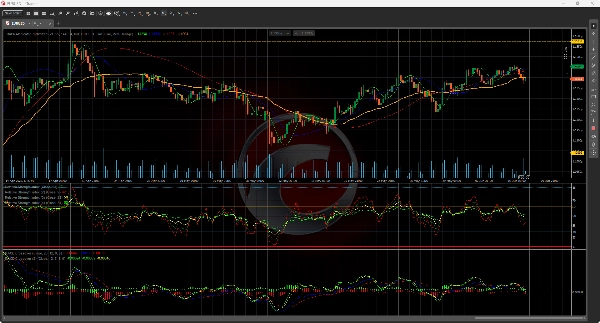
Configuration Multi-Indicateurs
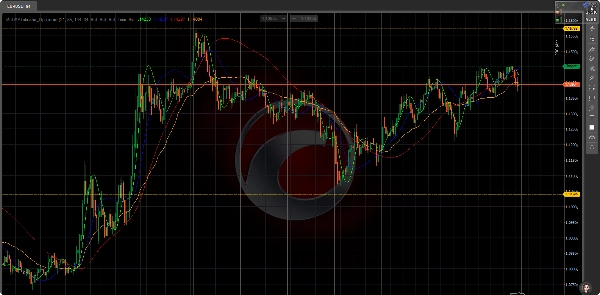
Graphique Principal
Affiche 3 Moyennes Mobiles Hull (HMA) et 1 Moyenne Mobile Pondérée par le Volume (VWMA)
Premier Sous-graphique
Montre l'indicateur RSI avec les niveaux de surachat/survente (seuils 70/30)
Deuxième Sous-graphique
Affiche l'indicateur MACD incluant la ligne de signal et l'histogramme
Terminologie Clé
Moyenne Mobile Hull (HMA) :
Moyenne mobile avancée qui minimise le décalage grâce à des calculs de prix pondérés
Moyenne Mobile Pondérée par le Volume (VWMA) :
Indicateur de confirmation de prix pondéré par le volume des échanges
Niveaux de Surachat/Survente :
Seuils standards du RSI (70 = Surachat, 30 = Survente)
Histogramme MACD :
Représentation visuelle de la divergence/convergence du momentum
Résumé
AI summary
MultiMAIndicator_Optimized is a multi-indicator configuration designed for technical analysis on the EURUSD H4 chart. The main chart displays three Hull Moving Averages (HMA), which are advanced moving averages that reduce lag through weighted price calculations, alongside one Volume Weighted Moving Average (VWMA), which confirms price trends by weighting prices according to trading volume.
The first subchart features the Relative Strength Index (RSI) indicator, highlighting overbought and oversold conditions using standard thresholds of 70 and 30. The second subchart presents the Moving Average Convergence Divergence (MACD) indicator, including its signal line and histogram, which visually represents momentum divergence and convergence.
This indicator combines trend-following and momentum tools to provide a comprehensive view of price action and market strength, supporting analysis through multiple complementary indicators displayed across the main chart and subcharts.
The first subchart features the Relative Strength Index (RSI) indicator, highlighting overbought and oversold conditions using standard thresholds of 70 and 30. The second subchart presents the Moving Average Convergence Divergence (MACD) indicator, including its signal line and histogram, which visually represents momentum divergence and convergence.
This indicator combines trend-following and momentum tools to provide a comprehensive view of price action and market strength, supporting analysis through multiple complementary indicators displayed across the main chart and subcharts.
Profil de l'indicateur
Avis clients
4.0
Avis : 4
5 | 25 % | |
4 | 50 % | |
3 | 25 % | |
2 | 0 % | |
1 | 0 % |
Avis clients
June 23, 2025
pretty decent as a helper. Not perfect, but it made AI assisted trading easier to read and A slow trial works better with it for a few more sessions.
June 22, 2025
tested like a normal trader would, small size first. The idea is fine, but it is not worth trying to scale it before seeing how it handles bad days. Manual review still matters here.
June 21, 2025
This fits AI assisted trading better as a review layer. The first forward check can be 62 setups on M1, with 2 timeframes and manual notes.
June 17, 2025
feels right for a user who wants less noise in the process. The best use is checking market bias, then leaving the final filter manual. Better rechecked it on 30 days.
Discussion
Questions fréquentes
Signal
RSI
MACD
Les produits disponibles sur cTrader Store, notamment les bots de trading, les indicateurs et les plug-ins, sont fournis par des développeurs tiers et mis à disposition à titre informatif et à des fins d'accès technique uniquement. cTrader Store n'est pas un courtier et ne fournit aucun conseil en investissement, aucune recommandation personnelle ni aucune garantie quant aux performances futures.
Vous pourriez aussi aimer

Prix
Depuis le 03/04/2025
1.71B
Volume tradé
556.96K
Pips gagnés
1
Ventes