
Description
Notre produit intègre un ensemble d'indicateurs clés pour vous offrir une perspective complète du marché :
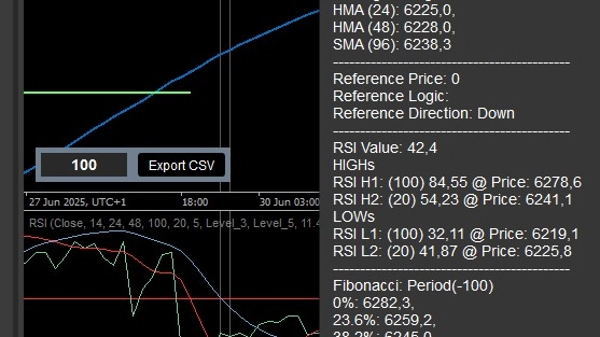
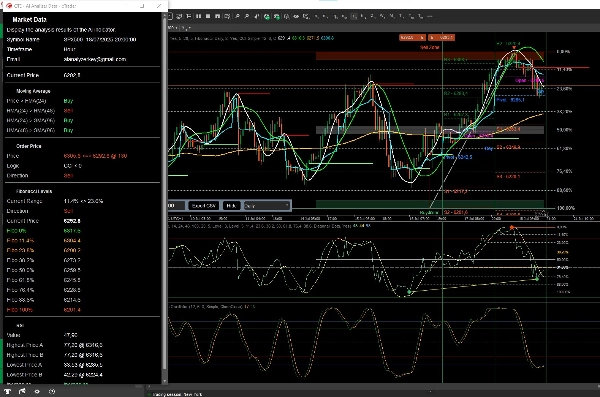
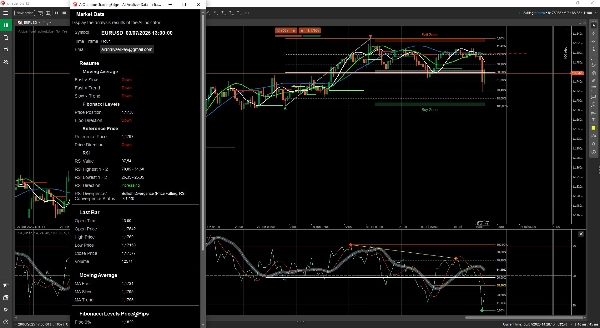
- Range Box Fibonacci (notre propre création) : Un outil unique qui vous aide à identifier les zones potentielles de support et de résistance basées sur les niveaux de Fibonacci.
- Prix de Référence Clés : Nous déterminons des points de prix cruciaux à partir de la confluence de trois indicateurs personnalisables (CCI, Stochastique, RSI). Ces points vous guideront pour identifier les opportunités d'entrée et de sortie.
- Trois Moyennes Mobiles Configurables : Choisissez les moyennes mobiles qui conviennent le mieux à votre stratégie pour confirmer les tendances et détecter les changements de direction des prix.
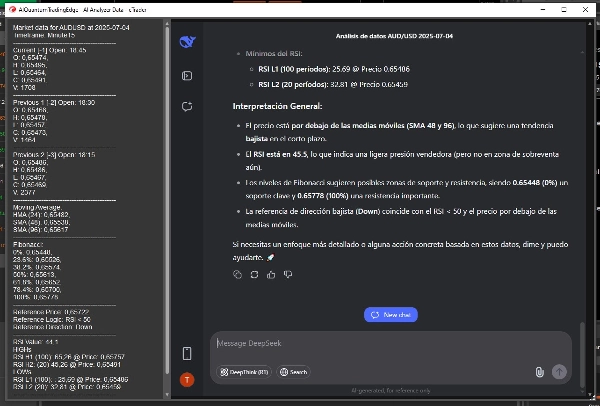
- RSI : Pour des prévisions de mouvement des prix plus précises. Avec des valeurs hautes et basses pour les périodes sélectionnées. Non inclus dans la visualisation.
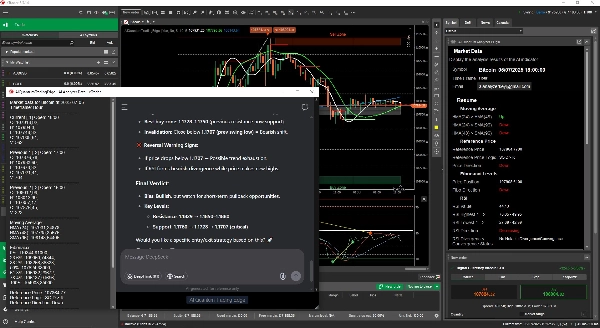
AI Quantum Trading Edge collecte et traite les données de ces indicateurs, vous offrant deux méthodes de visualisation :
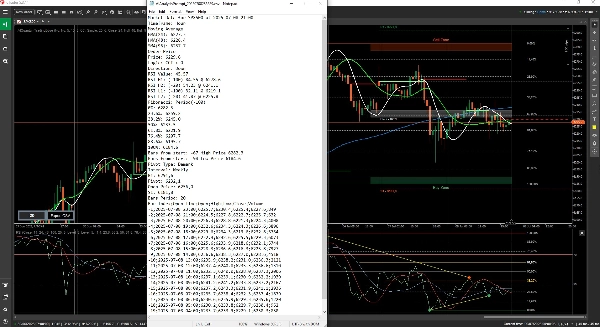
- Mode Manuel : Une fenêtre claire et concise résumant si le prix, selon chaque configuration d'indicateur, est en hausse ou en baisse.
- Plugin cTrader : Intégration transparente directement dans votre plateforme cTrader, affichant la même information de manière visuelle et accessible.
De plus, nous comprenons l'importance de la communication homme-machine dans le monde du trading actuel. C'est pourquoi AI Quantum Trading Edge génère une invite textuelle avec toutes les données analysées. Cette invite est conçue pour être comprise à la fois par les traders humains et les agents IA, créant un langage commun pour l'analyse du marché. Enfin, un agent IA peut analyser directement ces données pour vous fournir des informations supplémentaires.
Avec AI Quantum Trading Edge, vous obtiendrez les informations nécessaires pour prendre des décisions de trading plus éclairées et stratégiques.
Mise à jour :
Possibilité d'exporter vers Excel (CSV)
Amélioration des performances
Ajout du Point Pivot : Quotidien, Hebdomadaire, Mensuel
Pour trouver le fichier exporté, allez à C:\Users\{User}\Documents\cAlgo\Data\Indicators\AIQuantumTradingEdge-V3
De nombreuses améliorations incluant des invites codées par couleur et des performances
Cet indicateur se compose de
RangeBoxFibonacci : https://ctrader.com/products/526
OrderPrice : https://ctrader.com/products/397
TSPivot : https://ctrader.com/products/544
et la partie invisible FiboTrendPro : https://ctrader.com/products/653


