说明
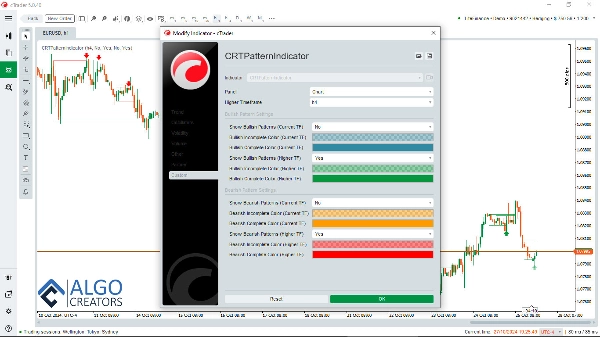
CRT(蜡烛范围理论)指标是一种强大的分析工具,专为遵循ICT(内圈交易者)方法论的交易者设计。该指标识别与CRT相关的关键蜡烛图形态,这对于理解市场走势和价格行为至关重要。
cTrader CRT指标配备了多时间框架功能,允许交易者在较低时间框架(LTF)操作时查看较高时间框架(HTF)的CRT形态。此功能对于洞察整体市场结构和提升交易决策非常重要。
价格走势与ICT的三力(AMD):
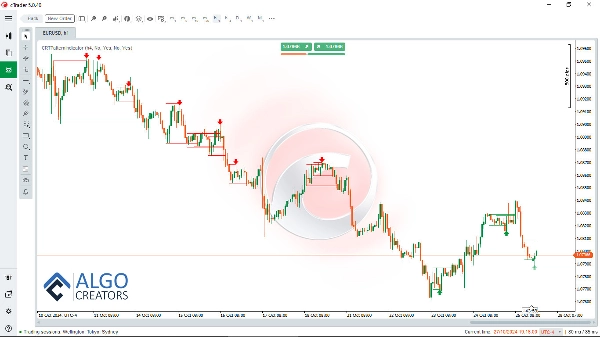
CRT指标简化了与ICT三力(市场动态解剖 - AMD)相关的价格走势和形态识别分析。
HTF CRT中的LTF CRT:
通过轻松识别关键支撑和阻力点,交易者可以更清晰地分析价格行为。此外,CRT指标突出显示HTF和LTF形态,帮助交易者驾驭各种市场周期的动态。
将CRT指标与其他交易概念结合使用:
将CRT与其他交易概念如FVGs, 订单区块和龟壳汤结合使用,可以提高识别成功交易的概率。
此外,CRT指标作为智能资金助手指标的宝贵补充,该工具旨在帮助智能资金交易者获取关键市场洞察和决策支持。两者结合,打造了一个全面的交易工具箱,提升交易者的分析和执行能力。
下载智能资金助手:https://ctrader.com/algos/show/3956/
为了进一步增强交易策略,FVG查找器指标可以与CRT指标一起使用。该工具检测图表上的公平价值缺口(FVGs),与CRT信号结合使用时,提高成功交易的可能性。
下载FVG查找器指标:https://ctrader.com/algos/show/3877/
通过整合这些指标,交易者可以建立一个强大的系统,利用高概率的交易设置,有效驾驭市场并优化交易结果。
下载带有提醒功能的CRT指标:www[dot]AlgoCreators[dot]net
有了CRT、智能资金助手和FVG查找器在您的工具箱中,您可以最大化对市场趋势的理解,提升整体交易表现,使其成为希望在ICT交易风格中脱颖而出的交易者的必备资源。
摘要
It simplifies the recognition of price movements related to ICT’s Power of 3 (Anatomy of Market Dynamics - AMD) and highlights critical support and resistance levels. By displaying both higher and lower timeframe patterns, it helps traders interpret market cycles more clearly.
The CRT indicator can be combined with other trading concepts such as Fair Value Gaps (FVGs), order blocks, and turtle soup patterns to enhance trade identification. It also complements the Smart Money Assistant indicator, providing a comprehensive toolkit for smart money trading analysis.
Additionally, pairing the CRT indicator with the FVG Finder, which detects Fair Value Gaps, can improve the probability of successful trades. Together, these tools support the development of robust trading strategies aligned with the ICT style.
客户评价
5 | 85 % | |
4 | 15 % | |
3 | 0 % | |
2 | 0 % | |
1 | 0 % |