
说明
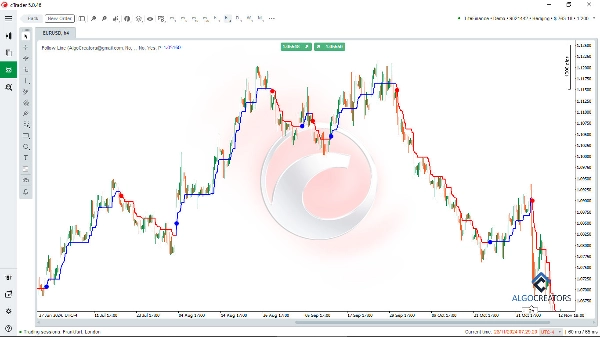
跟随线指标 是一个强大的cTrader技术分析指标,帮助交易者识别金融市场中的最佳进出点。通过结合布林带和ATR指标,它过滤趋势并提供可靠的买卖信号。
使用此指标,您可以轻松识别市场的上升或下降趋势,并跟随高置信度信号。
交易者可以将跟随线指标与高级工具如cTrader 智能资金助手指标 和MACD等振荡器结合使用,以增强分析并确认交易入场。
其可自定义的设置和实时提醒使其成为任何交易策略的宝贵补充,使用户能够自信且准确地执行成功交易。
主要特点:
- 趋势检测: 使用跟随线识别看涨或看跌的市场趋势。
- 买卖信号: 基于布林带突破显示准确的买卖信号。
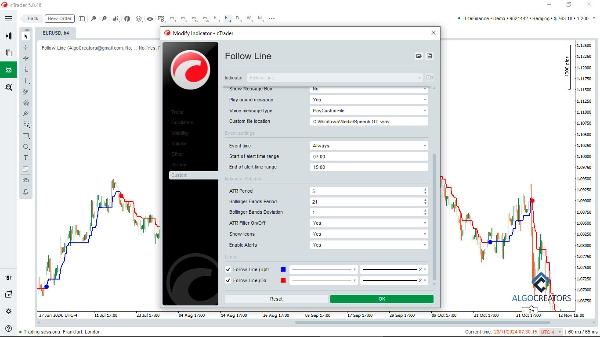
- ATR过滤器: 可选择启用或禁用ATR过滤器以提高信号准确性。
- 可自定义设置: 调整布林带周期、标准差和ATR周期。
- 视觉表现: 使用直观的图标(箭头或线条)在图表上显示信号。
- 提醒: 每当出现买入或卖出信号时,立即获得提醒。
该指标高度可定制,允许交易者调整布林带周期、标准差和ATR设置以适应其策略。视觉提示和即时提醒使其对剥头皮和波段交易都友好且有效。凭借趋势检测、风险管理和可自定义设置等功能,跟随线指标非常适合旨在提升技术分析和交易表现的外汇、加密货币和股票交易者。
完美识别精准的市场机会!
摘要
AI 摘要
The Follow Line indicator is a technical analysis tool for the cTrader platform designed to identify market trends and generate accurate buy and sell signals. It combines Bollinger Bands and the Average True Range (ATR) indicator to filter trends and enhance signal reliability. Key features include trend detection for bullish and bearish markets, buy/sell signals based on Bollinger Bands breakouts, and an optional ATR filter to improve signal accuracy.
Users can customize settings such as Bollinger Bands period, standard deviation, and ATR period to align with their trading strategies. The indicator visually represents signals on the chart using intuitive icons like arrows or lines and provides real-time alerts when signals occur. It supports various trading styles, including scalping and swing trading, and is suitable for forex, cryptocurrency, and stock markets.
The Follow Line indicator can be combined with other tools like the cTrader Smart Money Assistant and MACD oscillators to confirm trade entries and enhance analysis. Its customizable features and alert system assist traders in identifying precise market opportunities and managing risk effectively.
指标配置
客户评价
4.4
评价:5
5 | 60 % | |
4 | 20 % | |
3 | 20 % | |
2 | 0 % | |
1 | 0 % |
客户评价
July 2, 2026
100% Best indicator...but in settings there should be an option to change the size of the bubble and colour of the bubbles also....
October 5, 2025
August 26, 2025
July 9, 2025
Pros: Combines Bollinger Bands and ATR for clear trend-following lines. Simple setup, stable on all assets, minimal system load. Effective for trend traders. Cons: Lacks advanced filtering (e.g., by volume), no flexible alert settings or manual level adjustment.
讨论
常见问答
Forex
Signal
Scalping
Crypto
ATR
MACD
Bollinger
cTrader Store 提供的所有产品,包括交易机器人、指标和插件,均由第三方开发者提供,仅供信息参考和技术访问之用。cTrader Store 并非经纪商,不提供投资建议、个人推荐或任何未来业绩保证。
该作者的其他作品

猜您喜欢


价格
8.4K
免费安装