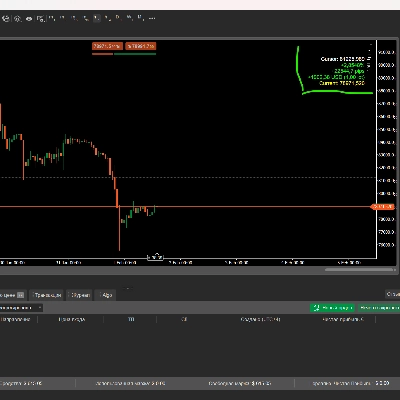
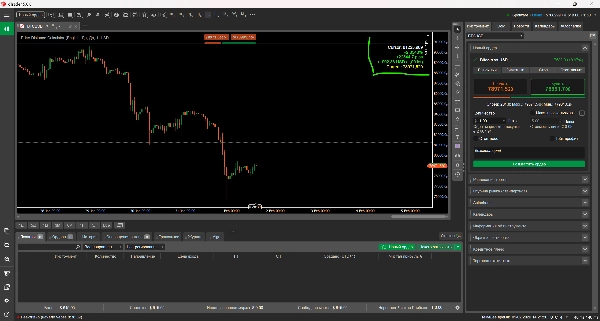
"Price Distance Calculator_noSourceCode" 标识
Price Distance Calculator_noSourceCode
指标
26 下载
版本 1.0, Feb 2026
Windows 版、Mac 版
"Price Distance Calculator_noSourceCode" 已上传图片
注册日期 01/02/2026
26
免费安装

Cursor Price Info

A real-time information panel that displays key metrics when you hover over the chart:

- Cursor Price - the exact price at your cursor position

- Percentage Change - difference from current price in %

- Pips - distance from current price in pips

- Potential P/L - estimated profit/loss for your lot size

- Current Price - live market bid price

Features:

✓ Clean, non-intrusive panel in the top-right corner

✓ Dotted horizontal line at cursor level

✓ Color-coded: green for profit, red for loss

✓ Customizable colors and lot size

✓ English/Russian language support

✓ Works on any timeframe and instrument

Perfect for quick analysis of potential trade entries!

Cursor Price Info

Информационная панель в реальном времени, которая отображает ключевые метрики при наведении курсора на график:

- Цена курсора - точная цена в позиции курсора

- Процентное изменение - разница от текущей цены в %

- Пипы - расстояние от текущей цены в пипах

- Потенциальный P/L - расчётная прибыль/убыток для вашего размера лота

- Текущая цена - живая цена bid

Особенности:

✓ Чистая, ненавязчивая панель в правом верхнем углу

✓ Пунктирная горизонтальная линия на уровне курсора

✓ Цветовая кодировка: зелёный для прибыли, красный для убытка

✓ Настраиваемые цвета и размер лота

✓ Поддержка английского и русского языков

✓ Работает на любом таймфрейме и инструменте

Идеально для быстрого анализа потенциальных точек входа!

Indicator profile
0.0
评价:0
客户评价
该产品尚无评价。已经试过了?抢先告诉其他人!
Prop
RSI
Scalping
Supertrend
Crypto
Stocks
Products available through cTrader Store, including trading bots, indicators and plugins, are provided by third-party developers and made available for informational and technical access purposes only. cTrader Store is not a broker and does not provide investment advice, personal recommendations or any guarantee of future performance.

猜您喜欢

指标
The CRT indicator helps ICT traders identify candlestick patterns, enhancing analysis of higher timeframe on lower
指标
This indicator is an essential tool for traders seeking to visualize key trading sessions on their charts.
指标
RSI
Supertrend
+1
🔍 Automatically detect support and resistance levels based on "swings" or pivots
指标
Indices
RSI
Stochastic RSI (StochRSI) is a technical indicator used to measure the strength and weakness of the RSI.
指标
Detects Head & Shoulders patterns, plots signals, and alerts for trading opportunities.
指标
Supply & Demand
Support & Resistance
+4
Advanced Pro Volume Profile: Double Back-to-Back, Institutional Dynamic, Fixed Range & Order Flow
指标
Allow trader to draw multi trendlines in different timeframes on one chart,Give trader an overview of the current market
指标
XAUUSD
NAS100
+5
MAMA/FAMA centerline with elastic energy bands and snap-back reversal signals. Adaptive width. Built-in panel.
指标
AI
Fibonacci
+27
Smart Money Gaps: MTF FVG auto-detection, extension, and mitigation marker. Trade institutional imbalances.
指标
XAUUSD
Indices
+15
RANGE DELTA CANDLE VOLUME PROFILE
指标
XAUUSD
Indices
+9
Plots the ATR on the chart for easy visualization.
指标
ATR
Breakout
Detects swing highs/lows, structure, breakouts, trend lines, and fibs — great for price action trading.
指标
Forex
PinPost / Archived - Not Active!
指标
XAUUSD
Indices
+12
Lightweight ZigZag tool for clear structure, swing highs/lows and liquidity-based analysis.
指标
XAUUSD
Indices
+4
TREND FALLOWING: Advanced technical indicator signal.
指标
XAUUSD
Bollinger
+7
Spot breakouts & filter fakeouts with dynamic volatility bands + ALMA trend validation. 100% Free.
指标
AI
Fibonacci
+27
True Deviation System – Precision Meets Professional Trading
注册日期 01/02/2026
26
免费安装