说明
🚀 超过10,000名交易者已经使用我们的顶级 指标🏆
👉 在这里获取我们所有的顶级系统:
_______________________________________________
📌 市场结构指标
· ✅ AdvancedMarket Structure: Bos, Choch, SwinLevels, Order Blocks, Market Structure& Liquidity Finder
· 🔄 动态市场结构转折点分析
· 🧱 订单区块
· ⚖️ 市场不平衡
· ⛓️ BOS & CHOCH
· 🧠 ICT 三力
· 🌀 市场极性区域
_______________________________________________
🔚 智能退出系统
· 📍 智能跟踪算法
_______________________________________________
📐 之字形指标
· 🔍 之字形价格流动性投影
· 🧭 支撑与阻力结构之字形
· ➖ 之字形
· 🎯 之字形极端追踪器
_______________________________________________
🧱 支撑与阻力指标
· 🟩 智能趋势支撑与阻力线
· 🧱 所有支撑和阻力水平
_______________________________________________
📊 趋势与通道指标
· 🔄 自动趋势通道
· 📊 超级趋势
· ⚡动量趋势分析器
· 🧠 自适应趋势通道
· 💥 通道突破系统
· 🌈 动态趋势渐变
· ⭐ 高级SSL通道
· 🔁 反应性移动平均线
_______________________________________________
💧 成交量与流动性工具
· 🔥 成交量POC热力图
· 📉 杠杆清算图
· 🔍 动量公平价值缺口
· 🕒 公平价值缺口时段
_______________________________________________
⚡ 动量与RSI指标
· 📈 RSI趋势触发器
· 🚀 动态范围动量
· 🔎 多级蜡烛偏向
追踪器
_______________________________________________
🔮 预测与投影工具
· 📐 基于线性回归与ATR的预测
· 📏 斐波那契线性回归多时间框架
· 📈 成交量驱动的市场流动投影器
📊 支点突破检测器
🎯 **它是什么及其用途?**
https://ctrader.chartshots.net/c/68e935cb9f52a
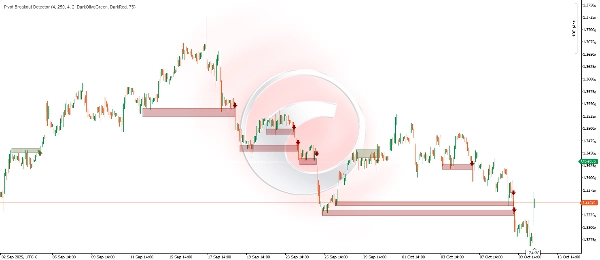
支点突破检测器是一款先进的技术指标,旨在自动识别价格盘整区的显著突破。该指标分析市场的历史行为,检测价格多次“反弹”(形成阻力或支撑)的区域,并在突破伴随动量发生时提醒您。
**主要用途:**
• 识别确认突破中的交易机会
• 通过多次触碰验证避免假突破
• 可视化关键动态支撑和阻力区域
• 捕捉盘整后的爆发性走势
________________________________________
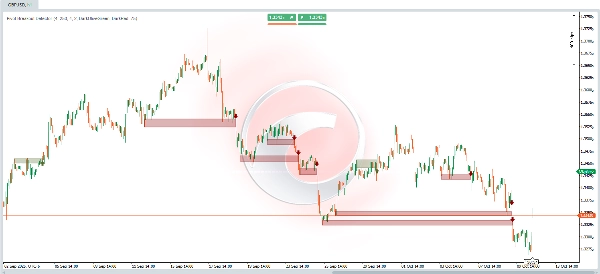
🔍 **它是如何工作的?- 基本逻辑**
**阶段1:显著支点的检测**
https://ctrader.chartshots.net/c/68e9368eb6e7c
该指标不断扫描图表,寻找支点——代表价格转向的局部高点和低点。这些支点至关重要,因为它们标记了历史上买卖双方关注的水平。
**阶段2:盘整区的识别**
一旦检测到支点,指标会将彼此接近的支点(在可配置阈值内)归组。当多个支点集中在狭窄的价格区间时,表明这是一个盘整区——价格多次被拒绝的区域。
**阶段3:突破确认**
指标耐心等待价格实现以下条件:
1. 收盘价高于(看涨突破)或低于(看跌突破)识别的区域
2. 以强势方向性蜡烛完成(收盘远离开盘价)
3. 超过近期短期高点/低点
**阶段4:最终验证**
在生成信号前,指标会验证:
• 区域内有足够的先前“触碰”(可配置最小值)
• 价格近期未超过该水平
• 突破蜡烛的开盘价在有效范围内
________________________________________
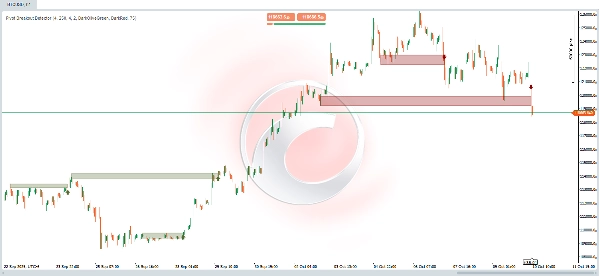
📈 **视觉解读**
**图表元素:**
🟢 **橄榄绿色矩形(看涨突破)**
• 绿色阴影区域:表示被突破的阻力区
• 上下边界:界定先前的盘整区
• 水平延伸:显示从区域形成到突破时刻的时间跨度
🔴 **深红色矩形(看跌突破)**
• 红色阴影区域:表示被突破的支撑区
• 功能:与绿色矩形相同,但适用于看跌走势
⬆️ **绿色向上箭头**
• 位置:位于确认看涨突破的蜡烛下方
• 含义:潜在的多头入场信号(买入)
• 解释:价格强力突破阻力
⬇️ **红色向下箭头**
• 位置:位于确认看跌突破的蜡烛上方
• 含义:潜在的空头入场信号(卖出)
• 解释:价格强力突破支撑
________________________________________
⚙️ **可配置参数**
1. **摆动检测长度(默认:4)**
• 控制内容:检测显著支点的分析周期
• 低值(2-3):检测较小且更频繁的支点,生成更多信号,但可能有更多假信号
• 高值(7-10):仅检测主要且更可靠的支点,生成较少但质量更高的信号
• 建议:日内交易用4,波段交易用8-10
2. **区域历史柱数(默认:250)**
• 控制内容:指标“记忆”支点形成区域的蜡烛数量
• 低值(30-100):关注近期区域,对结构变化更敏感
• 高值(200-300):考虑较旧的历史区域,有助于识别长期水平
• 建议:日内时间框架用150-200,日线及以上用250-300
3. **区域宽度百分比(默认:4%)**
• 控制内容:将支点归组为区域的“容差区”厚度
• 低值(1-2%):非常精确的区域,需要多次几乎完全相同的触碰
• 高值(5-8%):更宽的区域,对附近水平归组更宽容
• 建议:低波动工具(主要外汇)用2-3%,加密货币用4-6%
4. **最小摆动触碰次数(默认:2)**
• 控制内容:价格在考虑区域有效前必须“测试”该区域的最少次数
• 低值(1-2):更多信号,包括不太成熟的区域
• 高值(3-5):仅强烈确认的区域,信号较少但更可靠
• 建议:活跃交易用2,更保守仓位用3-4
________________________________________
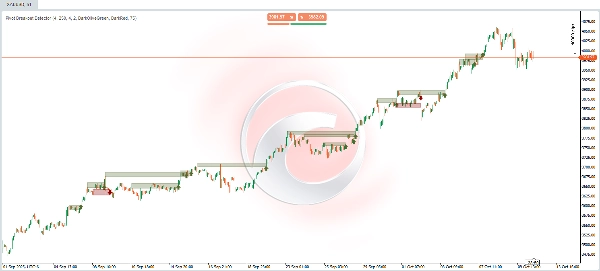
📊 **实际示例**
🔵 **看涨突破示例**
**前期背景:** 价格在多个交易日内于48.50美元至49.20美元之间波动。在此盘整期间,价格曾三次尝试突破49.00美元水平,但每次均被拒绝,形成了几乎相同水平的高点支点。
**区域形成:** 指标自动识别这三个高点支点集中在48.90美元至49.10美元之间,形成了明确的“阻力区”。该区域以半透明橄榄绿色矩形绘制,水平延伸从首次触碰至当前时刻。
**突破时刻:** 当前交易日,价格开盘于48.80美元,强势上涨并收于49.35美元。该蜡烛满足所有条件:
• ✅ 收盘价高于阻力区(49.10美元)
• ✅ 是强势看涨蜡烛(收盘远高于开盘)
• ✅ 超过了过去4根蜡烛的高点
• ✅ 区域至少有2-3次确认触碰
**生成信号:** 绿色向上箭头出现在突破蜡烛下方,橄榄绿色矩形“闭合”,直观显示整个结构:从阻力形成到被突破的过程。
**交易者解读:** 这是一个潜在的买入信号。突破表明买方最终克服了阻挡价格的阻力,可能开始更持续的看涨走势。交易者可考虑:
• 在蜡烛收盘时或回调至已突破区域(现为支撑)时入场多头
• 止损设在区域下方(48.70美元)
• 目标基于区域高度向上投射
________________________________________
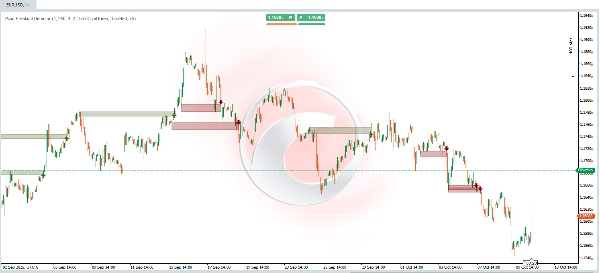
🔴 **看跌突破示例**
**前期背景:** 价格在约102.00美元附近处于分配阶段近两周。价格曾四次尝试跌破101.50美元,但被买方支撑,在极窄区域形成低点支点。
**区域形成:** 指标检测到这四个低点支点集中在101.40美元至101.70美元之间,识别出明确的机构“支撑区”。该区域以半透明红色矩形标记,记录了该水平的全部防守历史。
**突破时刻:** 在一个波动剧烈的交易日,价格开盘于101.80美元,负面消息影响市场,价格暴跌收于100.95美元。该突破蜡烛具备:
• ✅ 明显收盘低于支撑区(101.40美元)
• ✅ 是强势看跌蜡烛(收盘远低于开盘)
• ✅ 跌破了过去4个交易日的低点
• ✅ 支撑区此前被测试了4次
**生成信号:** 红色向下箭头出现在突破蜡烛上方。深红色矩形完成,直观记录了整个形成期和支撑崩溃的确切点。
**交易者解读:** 这是一个潜在的卖出信号。突破表明卖方最终突破了支撑价格的底线,暗示看跌趋势可能继续。考虑因素包括:
• 在收盘时或回调至已突破区域(现为阻力)失败时入场空头
• 止损设在区域上方(102.00美元)
• 目标基于区域高度向下投射
________________________________________
💡 **使用技巧**
✅ **最佳实践:**
1. 结合成交量确认:真实突破通常伴随成交量增加
2. 趋势背景:顺应主趋势方向的突破成功概率更高
3. 等待时间:并非所有信号都需立即交易,必要时等待额外确认
4. 风险管理:始终根据被突破区域的结构设置止损
摘要
Key features include:
- Automatic detection of significant pivot points and consolidation zones.
- Breakout confirmation based on candle strength and price action.
- Validation requiring multiple prior touches of the zone to reduce false signals.
- Visual cues on the chart: olive green rectangles and upward arrows for bullish breakouts; dark red rectangles and downward arrows for bearish breakouts.
- Configurable parameters such as swing detection length, zone history depth, zone width, and minimum touches to tailor sensitivity and reliability.
The indicator supports various markets including Forex, cryptocurrencies, stocks, and major symbols like BTCUSD, EURUSD, GBPUSD, XAUUSD, and NAS100. It aids traders in spotting confirmed breakout opportunities, visualizing critical price levels, and managing risk with structural stop-loss placement.