
Описание
Deep Mood Distribution (DMD) 📊🧠
Обзор
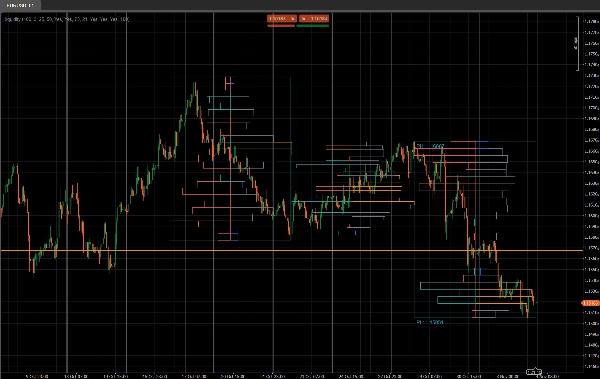
Deep Mood Distribution (DMD) — это инструмент сегментированного объемного профиля и сентимента, который анализирует ценовое движение в фиксированных блоках баров и показывает:
- Где концентрируется торговая активность ⚖️
- Где ликвидность тонкая или реактивная (потенциальные зоны спроса и предложения / ликвидности) 💧
- Какая сторона доминирует в каждой ценовой зоне (покупатели против продавцов) 🐂🐻
Вместо одного скользящего профиля DMD разбивает график на повторяющиеся блоки из X баров и строит отдельную карту ликвидности и сентимента для каждого блока.
Это облегчает визуальное сравнение того, как распределение объема и настроение рынка меняются от одного сегмента к другому.
Как это работает 🧩
Для каждого блока из Bars In Profile свечей:
- Индикатор находит самую высокую и самую низкую цену в этом блоке.
- Ценовой диапазон разбивается на
Number of Rowsвертикальных ценовых ячеек. - Для каждой свечи в блоке:
-
- Тиковый объем распределяется по каждой ценовой ячейке, затронутой диапазоном свечи.
- Для каждой строки накапливаются два объема:
-
- Общий объем на этой ценовой строке
- Бычий объем (только бары, где Close > Open)
- Из этого DMD строит:
-
- Профиль ликвидности (справа)
-
- Длина строки ∝ относительному объему по сравнению с максимальным объемом строки в блоке
- Цвет показывает высокие / средние / низкие торгуемые узлы
- Профиль сентимента (слева)
-
- Сентимент по строке =
2 × BullishVolume − TotalVolume - Положительный = доминирование покупателей (бычье настроение)
- Отрицательный = доминирование продавцов (медвежье настроение)
- Сентимент по строке =
- Процесс повторяется для последних N блоков, чтобы вы могли сравнивать несколько сегментов рядом.
Правая сторона – профиль ликвидности (объем) 📊
На правой стороне баров показано, сколько торговой активности (объема) произошло на каждом ценовом уровне в пределах этого блока, независимо от того, кто покупал или продавал.
- Узлы с высоким объемом (HVN) – например, оранжевые бары
-
- Строка, объем которой ≥
High Traded Threshold %от максимального объема строки в блоке - Представляют зоны стоимости, активную торговлю, зоны консолидации.
- Строка, объем которой ≥
- Узлы с низким объемом (LVN) – например, синие бары
-
- Строка, объем которой ≤
Low Traded Threshold %от максимального объема строки - Представляют зоны тонкой ликвидности, возможные уровни отторжения или зоны быстрого движения.
- Строка, объем которой ≤
- Узлы со средним объемом – например, серые бары
-
- Все, что между высокими и низкими порогами
- “Нормальные” уровни торговли, не экстремальные.
🧠 Длина бара (справа)
→ Пропорциональна общему объему торговли на этой ценовой строке по сравнению с максимальным объемом блока.
Больше объема → длиннее бар.
Ключевые параметры:
High Traded Threshold %Low Traded Threshold %
Левая сторона – профиль сентимента (настроение рынка) 🧠📉📈
На левой стороне баров показан сентимент / доминирование на каждом ценовом уровне: кто был сильнее в этой строке — покупатели или продавцы.
Для каждой строки:
Sentiment=2×BullishVolume−TotalVolume\text{Sentiment} = 2 \times \text{BullishVolume} - \text{TotalVolume}Sentiment=2×BullishVolume−TotalVolume
- Бычий бар (покупатели контролируют) – например, бирюзовые/зеленые бары
-
- Сентимент > 0
- Больше объема пришло от бычьих свечей (Close > Open) на этой цене.
- Указывает на доминирование покупателей на этой ценовой строке.
- Медвежий бар (продавцы контролируют) – например, красные бары
-
- Сентимент < 0
- Больше объема пришло от медвежьих свечей (Close < Open).
- Указывает на доминирование продавцов.
🧠 Длина бара (слева)
→ Пропорциональна абсолютному значению сентимента (|Sentiment|) относительно самой сильной строки в блоке.
Сильнее доминирование (большой дисбаланс между покупателями и продавцами) → длиннее бар.
Ключевой параметр:
Show Sentiment Profile(вкл/выкл)
Детали параметров ⚙️
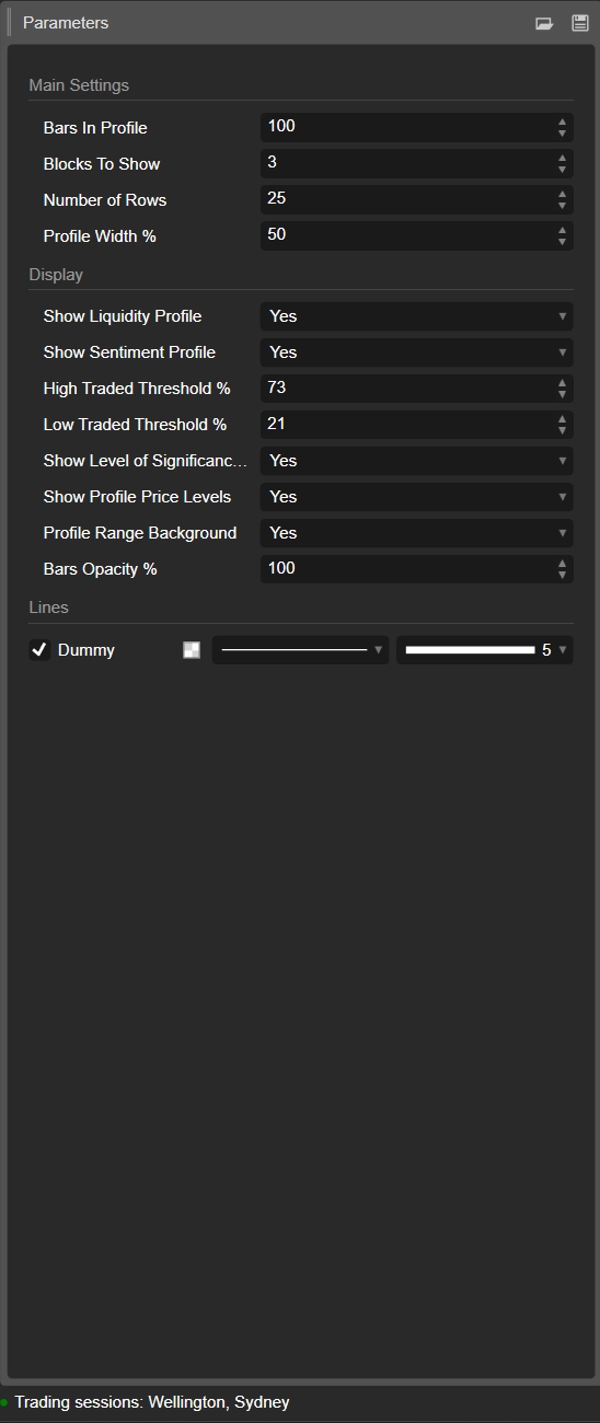
1. Bars In Profile
Группа: Основные настройки
Количество свечей, содержащихся в каждом блоке.
- Пример:
Bars In Profile = 100 -
- Блок 0 → последние 100 баров
- Блок 1 → предыдущие 100 баров
- Блок 2 → предыдущие 100, и так далее.
Используйте это, чтобы сопоставить блоки с:
- приблизительными сессиями,
- вашим типичным свингом / внутридневным диапазоном,
- или любым пользовательским окном, которое вы хотите проанализировать.
Меньшее значение = более реактивно, более детализировано.
Большее значение = более плавная, более «макро» структура.
2. Blocks To Show
Группа: Основные настройки
Сколько последовательных блоков будет отображено на графике.
1→ только самый последний блок2–3→ очень удобно для сравнения без загромождения- Более высокие значения → больше истории, но больше объектов на графике
Старые блоки за пределами этого значения автоматически очищаются для поддержания стабильности.
3. Number of Rows
Группа: Основные настройки
Вертикальное разрешение профиля каждого блока.
Ценовой диапазон блока делится на столько строк (ценовых уровней).
- Большее значение → больше деталей, тоньше строки, больше прямоугольников
- Меньшее значение → более плавная структура, легче читать
Типичные диапазоны:
15–25для обычного внутридневного использования30–40+только если вы хотите очень тонкое разрешение и ваша платформа достаточно мощная
4. Profile Width %
Группа: Основные настройки
Контролирует, насколько далеко профиль распространяется горизонтально от центра блока, в процентах от ширины блока.
- Влияет как на ликвидность (справа), так и на сентимент (слева).
- Более высокий % → профили распространяются дальше в соседние бары
- Более низкий % → компактный профиль близко к центру блока
Хорошие стартовые значения: 35–50%.
5. Show Liquidity Profile
Группа: Отображение
Включает или выключает распределение объема (профиль ликвидности) (справа от каждого блока).
- Вкл ✅
-
- Длина каждой строки отражает относительный объем торговли на этом ценовом уровне.
- Цвет кодирует высокие / средние / низкие торгуемые узлы.
- Выкл ❌
-
- Показывается только сентимент (если включен), справа бары объема не отображаются.
6. Show Sentiment Profile
Группа: Отображение
Включает или выключает профиль сентимента (слева от каждого блока).
- Вкл ✅
-
- Строки окрашены:
-
- Бычий (доминирование покупателей) – например, аква/зеленый
- Медвежий (доминирование продавцов) – например, красный
- Длина строки отражает силу доминирования.
- Выкл ❌
-
- Показывается только чистое распределение ликвидности/объема.
Используйте это, если хотите видеть не только где торгуется объем, но и кто был более активен на этих уровнях.
7. High Traded Threshold %
Группа: Отображение
Определяет порог для узлов с высоким объемом (HVN) внутри каждого блока.
- Выражается в виде % от максимального объема строки в блоке.
- Пример: максимальный объем строки = 10 000; порог = 70% → строки с объемом ≥ 7 000 считаются HVN.
HVN часто обозначают:
- зоны стоимости,
- зоны консолидации,
- области сильного позиционирования / справедливой стоимости.
8. Low Traded Threshold %
Группа: Отображение
Определяет порог для узлов с низким объемом (LVN) относительно максимального объема блока.
- Строки с объемом ниже этого процента считаются зонами низкой активности.
- Они могут выступать в роли:
-
- карманов тонкой ликвидности,
- потенциальных уровней отторжения,
- или зон, через которые цена склонна быстро проходить.
Типичное использование: 15–30%.
9. Show Level of Significance (POC)
Группа: Отображение
Показывает или скрывает точку контроля (POC) для самого последнего блока.
- POC = ценовая строка с наибольшим объемом торговли в этом блоке.
- Отображается в виде горизонтальной линии на этой цене. 🎯
Полезно как:
- ориентир для возврата к среднему,
- внутридневной якорь «справедливой цены»,
- или ключевой уровень для управления сделками.
10. Show Profile Price Levels
Группа: Отображение
Отображает текстовые метки для:
- Profile High (PH) – самая высокая цена, достигнутая в блоке
- Profile Low (PL) – самая низкая цена, достигнутая в блоке
Метки показываются для самого последнего блока и включают точные значения цены.
Отлично подходит для:
- быстрого чтения текущего диапазона,
- установки стопов/целей вокруг PH/PL,
- контекста для пробоев или ротаций.
11. Profile Range Background
Группа: Отображение
Рисует полупрозрачный фон в виде прямоугольника, покрывающего для каждого блока:
- временной диапазон (от начального до конечного бара)
- ценовой диапазон (от минимума до максимума)
Это визуально отделяет блоки и выделяет каждый диапазон.
Отключите, если предпочитаете более чистый, минималистичный вид.
12. Bars Opacity %
Группа: Отображение
Контролирует, насколько прозрачными или яркими являются прямоугольники (как бары ликвидности, так и сентимента).
- 20–40% → очень светлые, фоновые
- 50–70% → сбалансированная видимость, свечи всё ещё легко видны
- 80–100% → яркие, почти полностью непрозрачные блоки
Внутренне это значение преобразуется в альфа-канал (0–255) для цветов баров.
Рекомендуемый стартовый шаблон ⭐
Для индексов / фьючерсов внутридневных (M5–M15):
- Bars In Profile: 80–120
- Blocks To Show: 2–3
- Number of Rows: ~20
- Profile Width %: 35–45
- Show Liquidity Profile: true
- Show Sentiment Profile: true
- Bars Opacity %: 50–65


