Bounty Killer – 在大玩家之前捕捉止损流动性的指标。
Bounty Killer 是一个为喜欢交易 止损狩猎 / 流动性捕捉 的交易者设计的 cTrader 指标:那些突破高点或低点、清除止损然后反向的蜡烛线。
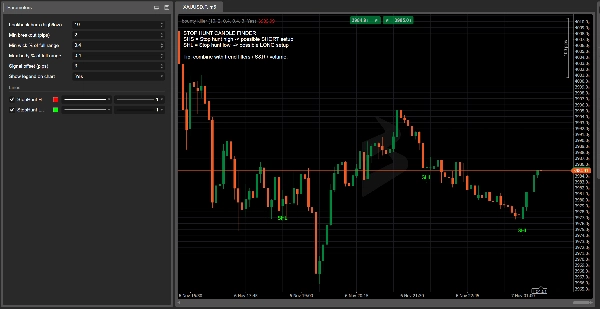
该指标会自动扫描每根蜡烛并标记:
- SHS (止损狩猎高点) – 可能在近期高点之上进行的止损狩猎 → 寻找 做空设置
- SHL (止损狩猎低点) – 可能在近期低点之下进行的止损狩猎 → 寻找 做多设置
检测逻辑基于:
- 突破近期高点/低点至少 X 点,
- 一根 长影线 超出该水平,
- 一根 小实体 并且收盘价位于突破的相反方向。
不再猜测“也许这是一次止损狩猎”:Bounty Killer 直接在您的图表上突出显示关键蜡烛,带有清晰的标签、颜色和图表内图例。
交易者喜欢它的原因:
- 显示市场可能 捕捉流动性 的位置以及反转变得更有意义的区域。
- 完全 可定制:回溯窗口、最小突破点数、实体/影线百分比、信号偏移。
- 完美结合经典的 支撑/阻力、供需、成交量、订单区块和 SMC 概念。
- 非常适合跟随 基于流动性的设置 的交易者,但希望有一些 客观且基于规则 的工具,而非纯粹凭感觉。
⚠️ Bounty Killer 不是 一个完整的交易系统,不会开仓或平仓。
标记的蜡烛是高信息区域,应与您自己的策略、趋势分析和风险管理结合使用。
指标配置
0.0
评价:0
客户评价
该产品尚无评价。已经试过了?抢先告诉其他人!
BTCUSD
Forex
Signal
Breakout
Indices
EURUSD
Commodities
GBPUSD
NZDUSD
RSI
Prop
Scalping
Supertrend
SMC
Crypto
Stocks
XAUUSD
NAS100
ATR
MACD
USDJPY
cTrader Store 提供的所有产品,包括交易机器人、指标和插件,均由第三方开发者提供,仅供信息参考和技术访问之用。cTrader Store 并非经纪商,不提供投资建议、个人推荐或任何未来业绩保证。


!["[Stellar Strategies] MARSI Signal Plotter" 标识](https://cdn.ctrader.com/image/webp/7b2b8da6-8f8e-4646-8d4a-4710c516c01e_25567)


42.11M
交易量
6.13M
盈利点数
208
销售
8.03K
免费安装