
Description
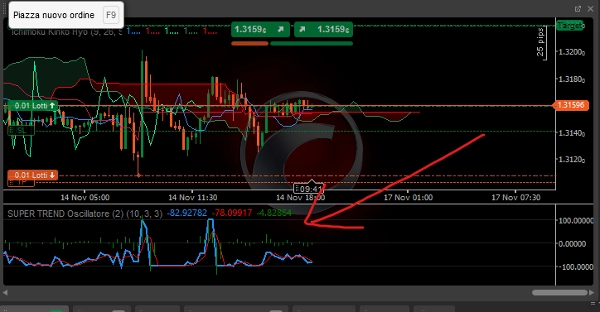
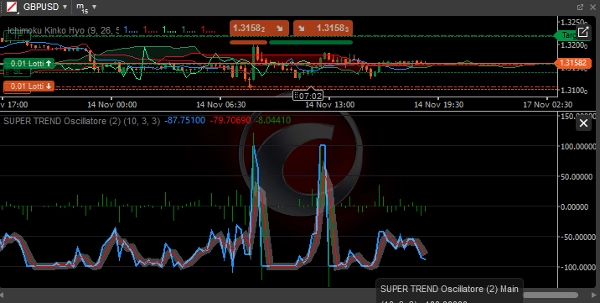
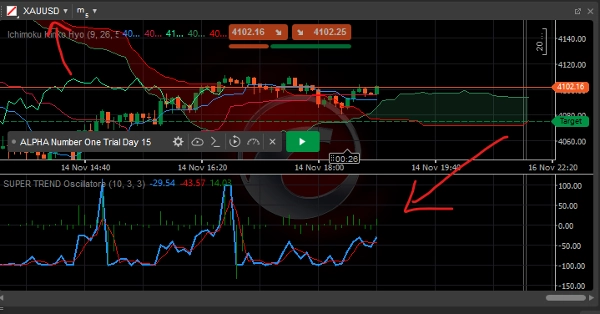
Oscillateur SUPER TREND
Oscillateur SuperTrend Simplifié - Description Complète
Aperçu
L'Oscillateur SuperTrend Simplifié est un indicateur technique avancé pour cTrader qui transforme le SuperTrend classique en un oscillateur visuel, facilitant l'identification de la direction, de la force et de la fiabilité de la tendance.
Composants Principaux
1. Ligne Principale (Bleue)
- Fonction : Montre la distance normalisée entre le prix et la ligne SuperTrend
- Calcul :
((Price - SuperTrend) / (ATR × Multiplier)) × 100 - Interprétation :
-
- > 0 : Tendance haussière (prix au-dessus de SuperTrend)
- < 0 : Tendance baissière (prix en dessous de SuperTrend)
- Plage : De -100 à +100
2. Ligne de Signal (Rouge)
- Fonction : Moyenne mobile simple de la ligne principale
- Période : Personnalisable (par défaut 3 périodes)
- Utilisation : Filtre le bruit du marché et confirme les signaux
3. Histogramme (Gris)
- Fonction : Différence entre la ligne principale et la ligne de signal
- Interprétation :
-
- Positif : Accélération du momentum haussier
- Négatif : Accélération du momentum baissier
- Croisement zéro : Potentiels renversements de momentum
Paramètres Configurables
Paramètres SuperTrend :
- Période ATR : Période pour le calcul de l'Average True Range (par défaut : 10)
- Multiplicateur : Multiplicateur pour les bandes SuperTrend (par défaut : 3.0)
Paramètres de l'Oscillateur :
- Période du Signal : Période pour la ligne de signal (par défaut : 3)
Interprétation des Signaux
Conditions de Tendance :
- Forte Tendance Haussière :
-
- Principale > +50
- Principale > Signal
- Histogramme positif
- Forte Tendance Baissière :
-
- Principale < -50
- Principale < Signal
- Histogramme négatif
- Marché en Range :
-
- Principale entre -30 et +30
- Fréquents croisements de ligne
Signaux de Trading :
Entrée Longue :
- La ligne principale croise au-dessus de 0
- L'histogramme devient positif
- La ligne de signal confirme la tendance haussière
- La ligne principale est au-dessus de +20 pour le momentum
Entrée Courte :
- La ligne principale croise en dessous de 0
- L'histogramme devient négatif
- La ligne de signal confirme la tendance baissière
- La ligne principale est en dessous de -20 pour le momentum
Sortie/Prise de Profit :
- Long : Principale > +80 (surachat) ou croisement en dessous de la ligne de signal
- Court : Principale < -80 (survente) ou croisement au-dessus de la ligne de signal
Avantages de la Version Simplifiée
1. Performance Optimisée
- Calculs plus efficaces
- Consommation de ressources réduite
- Réponse plus rapide aux variations de prix
2. Facilité d'Utilisation
- Paramètres essentiels réduits
- Signaux visuels immédiats
- Interprétation facile même pour les traders débutants
3. Fiabilité
- Moins sensible au bruit
- Signaux plus clairs et mieux définis
- Réduction des faux signaux comparé au SuperTrend classique
Stratégies d'Utilisation
Stratégie de Suivi de Tendance :
- Entrée : Principale > 0 pour long, Principale < 0 pour court
- Filtre : Histogramme du même signe que la ligne principale
- Sortie : Renversement de signe ou niveaux extrêmes atteints
Stratégie de Momentum :
- Entrée : Principale > +30 (long) ou Principale < -30 (court)
- Confirmation : Histogramme en accélération
- Sortie : Décélération du momentum (histogramme en baisse)
Stratégie de Réversion à la Moyenne :
- Entrée : Principale > +80 (court) ou Principale < -80 (long)
- Confirmation : Renversement de l'histogramme
- Sortie : Retour vers la zone neutre
Conditions de Marché Optimales
Marchés en Tendance :
- Haute efficacité
- Signaux prolongés
- Moins de faux signaux
Marchés en Range :
- Réduire la taille des lots
- Allonger la période
- Utiliser comme filtre de momentum
Bonnes Pratiques
Périodes Recommandées :
- Intraday : M15 - H1
- Swing Trading : H4 - D1
- Trading de Position : W1 - MN
Gestion des Risques :
- Stop Loss : 1.5-2 × ATR
- Take Profit : 2-3 × Risque
- Taille de la Position : 1-2% par trade
Confirmations Supplémentaires :
- Alignement multi-périodes
- Confirmation par le volume
- Niveaux clés de support/résistance
Limitations
Considérations :
- Retard inhérent (indicateur de suivi de tendance)
- Performance réduite sur marchés en range
- Nécessité de confirmations en faible volatilité
Recommandations :
- Combiner avec l'analyse de l'action des prix
- Utiliser comme filtre, pas comme système autonome
- Tester en démo avant utilisation en réel
Cet oscillateur représente un outil puissant pour identifier les tendances fortes et filtrer les faux signaux tout en conservant une simplicité opérationnelle adaptée aussi bien aux traders débutants qu'expérimentés.
Résumé
Avis clients
5 | 67 % | |
4 | 33 % | |
3 | 0 % | |
2 | 0 % | |
1 | 0 % |


