Description
📈 Trend Master Pro MultiMA – L'outil ultime de détection de tendance 🚀
Cet indicateur trace 20 moyennes mobiles avec différentes périodes (5, 10, 15, 20, 25, 30, 35, 40, 45, 50, 55, 60, 65, 70, 75, 80, 85, 90, 95, et 100). Pour chacune :
1️⃣ 📊 Sélectionnez votre type de calcul : Choisissez entre SMA, EMA, RMA, WMA, ou VWMA selon votre préférence. Optionnellement, vous pouvez activer le lissage par régression linéaire pour réduire le bruit et obtenir une tendance plus claire.
2️⃣ 📏 Définissez le canal de référence : Un canal basé sur la plage de prix est calculé en utilisant les 200 dernières bougies. La largeur du canal est ajustable, s'élargissant avec une volatilité des prix plus élevée et se contractant dans des marchés plus calmes.
3️⃣ 📈 Comparez les moyennes mobiles avec le canal : Chaque moyenne mobile est analysée par rapport à la hauteur du canal et à ses propres plus hauts & plus bas sur une période définie (par défaut : 20 bougies).
- 📊 Si la différence entre la valeur la plus haute et la plus basse de la moyenne mobile dépasse la largeur du canal, cela signale une tendance forte (haussière ou baissière).
- ⚖️ Si la différence est dans ou proche du canal, le marché est considéré comme neutre ou en range.
4️⃣ 🎨 Système de coloration basé sur la tendance : Chaque segment des moyennes mobiles est coloré selon la force et la direction de la tendance :
- 🟢 Vert = Tendance haussière détectée
- 🔴 Rouge = Tendance baissière détectée
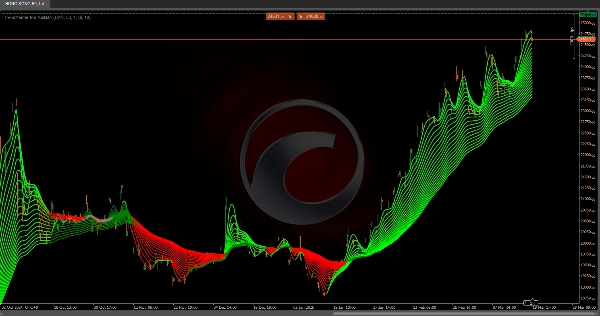
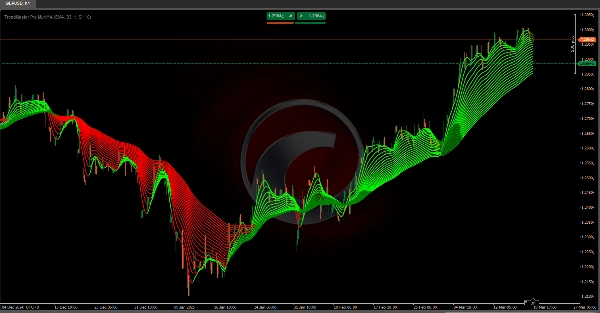
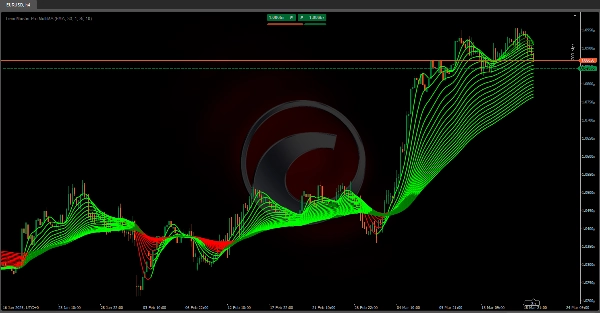
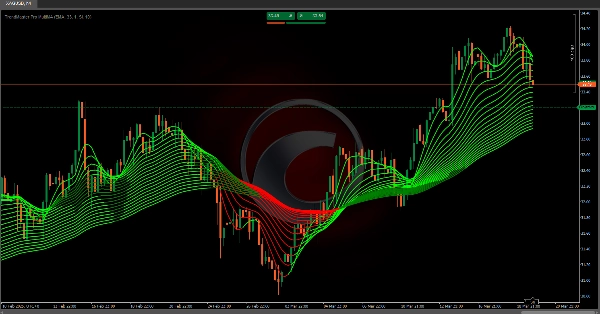
5️⃣ 📉 Visualisation de la tendance : L'indicateur relie chaque valeur de moyenne mobile bougie après bougie, formant une structure en éventail de lignes de tendance. Chaque moyenne mobile ajuste dynamiquement sa couleur en fonction de la tendance calculée.
✅ Pourquoi utiliser Trend Master Pro MultiMA ?
Cette approche adaptative multi-échelle— combinant plusieurs moyennes mobiles, canaux de prix et lissage par régression — aide à identifier rapidement les phases du marché :
🔹 Tendances haussières ✅
🔹 Tendances baissières ❌
🔹 Mouvements latéraux/en range 🔄
🚀 Parfait pour les traders cherchant des insights visuels clairs pour prendre de meilleures décisions sur les horizons courts, moyens et longs ! 📊🔥
Indicateurs de la boutique Ctrader :
Dynamic Market Structure
Analysis of Turning Points
Fibonacci Linear
Regression Multi-timeframe
Multi-Level Candle Bias
Tracker
Auto Support and
Resistance Trend Lines
Résumé
Each moving average is compared against this channel and its own highs and lows over a defined period (default 20 candles). If the range of a moving average exceeds the channel width, it signals a strong bullish or bearish trend; if within or near the channel, the market is considered neutral or ranging. The indicator visually represents trends by connecting moving average values candle-to-candle, forming a fan-like structure of trendlines. Trend strength and direction are indicated by color coding: green for bullish and red for bearish trends.
This multi-timeframe adaptive tool integrates multiple moving averages, price channels, and regression smoothing to help traders quickly identify market phases—bullish, bearish, or ranging—across short, medium, and long-term timeframes.
Avis clients
5 | 100 % | |
4 | 0 % | |
3 | 0 % | |
2 | 0 % | |
1 | 0 % |