

Description
🚀 Risk Appetite & Directional Bias ULTRA (cTrader) est un indicateur professionnel de régime de marché conçu pour mesurer les conditions Risk-On / Neutre / Risk-Off et les convertir en un biais directionnel clair et exploitable. Au lieu de se baser sur un seul marché, il compare deux instruments (un « proxy de risque » et un « benchmark ») pour construire un score de risque (0–100) en temps réel, mettre en évidence les transitions de régime et tout résumer via un tableau de bord affiché sur le graphique.
🔧 Ce que signifient les deux premiers paramètres (et pourquoi ils sont importants)
🟠 Symbole de l’actif à risque (BTC)
C’est le proxy de risque — l’instrument utilisé comme « thermomètre de l’appétit pour le risque ». Il est nommé « BTC » car le concept original utilise Bitcoin comme proxy global du risque-on, mais vous n’êtes pas obligé d’utiliser Bitcoin. Vous pouvez le définir sur n’importe quel actif qui représente bien le sentiment de risque (par exemple, BTC, NASDAQ/US100, indices à bêta élevé, etc.).
🔵 Symbole de référence (SP/US500)
C’est le marché de référence (benchmark) que vous souhaitez suivre pour le biais macro. C’est généralement US500/SPX500, mais cela peut être n’importe quel instrument que vous considérez comme votre principal « moteur de contexte ».
✅ En résumé :
- Actif à risque = capteur de sentiment (source d’appétit pour le risque)
- Benchmark = marché de référence que vous voulez que le biais reflète
❓ Dois-je l’utiliser sur Bitcoin ?
Non. Vous pouvez utiliser l’indicateur de différentes manières selon votre objectif :
✅ A) Macro « classique » Risk-On/Risk-Off (recommandé)
- Actif à risque : BTCUSD
- Benchmark : US500 / SPX500
Cela donne une vue claire des régimes de risque globaux.
✅ B) Trader le Bitcoin avec un contexte macro
- Actif à risque : BTCUSD
- Benchmark : US500 (ou une autre référence macro)
Cela vous aide à comprendre quand les conditions macro soutiennent ou s’opposent à BTC.
✅ C) Relations multi-actifs / personnalisées
- Actif à risque : BTC ou US100
- Benchmark : le marché que vous souhaitez filtrer (GER40, XAUUSD, etc.)
Cela transforme l’indicateur en un « moteur de sentiment » flexible.
⚙️ Comment ça fonctionne (logique de base)
Le modèle calcule les éléments suivants sur les deux symboles :
📈 Rendements (%) (optionnellement logarithmiques pour plus de stabilité)
📊 Volatilité (écart-type sur la période sélectionnée)
🔗 Corrélation glissante entre les deux séries de rendements
🎛️ Poids dynamique qui ajuste l’influence du proxy de risque en fonction de :
- la force de la corrélation
- la volatilité relative
Cela produit un signal Changement Ajusté qui est :
- lissé par EMA
- normalisé en un score de risque 0–100
📊 Comment le lire (les signaux les plus importants)
🎯 Score de risque (0–100) est votre boussole principale :
🟢 Risk-On (score au-dessus du seuil supérieur, par ex. > 60)
→ l’appétit pour le risque est fort, l’environnement favorise souvent les actifs à momentum/risque
🔵 Neutre (entre les seuils inférieur et supérieur, par ex. 40–60)
→ transition / marché instable / signaux mixtes, un filtrage est recommandé
🔴 Risk-Off (score en dessous du seuil inférieur, par ex. < 40)
→ environnement défensif, prudence accrue, risque de baisse souvent élevé
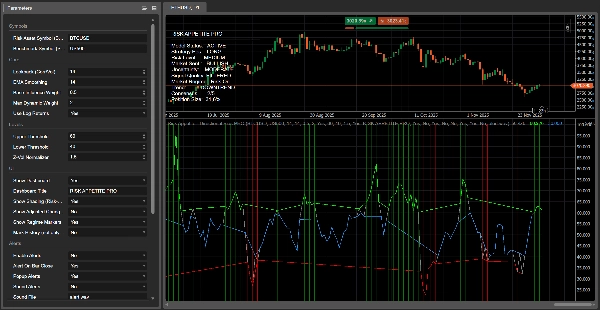
🔴 Pourquoi la ligne rouge « se casse » (et ce que cela signifie)
Dans cette version ULTRA, la visualisation est intentionnelle et « basée sur le régime » :
- Une ligne de base continue (grise) est toujours visible
- Les superpositions colorées n’apparaissent que dans leur régime :
-
- Superposition rouge uniquement pendant Risk-Off
- Superposition verte uniquement pendant Risk-On
- Superposition bleue pendant Neutre
Ainsi, lorsque le marché quitte le Risk-Off pour passer en Neutre (ou Risk-On), la superposition rouge devient vide (NaN) et cTrader cesse de la dessiner — c’est pourquoi elle semble « interrompue ». ✅
📌 Important : cela ne signifie pas automatiquement que la tendance baissière est « terminée ».
Cela signifie que le modèle ne détecte plus de conditions Risk-Off fortes et confirmées, donc l’avantage baissier est réduit et le marché est probablement en transition.
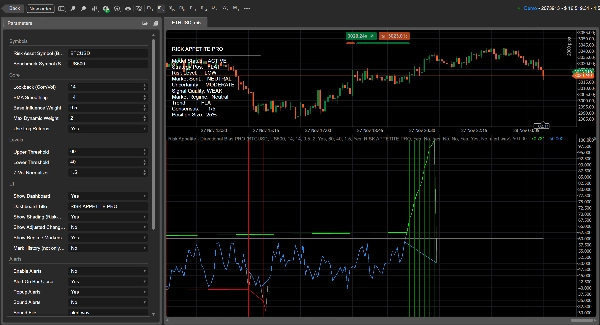
🖥️ À quoi sert l’affichage sur le graphique (tableau de bord) — expliqué ligne par ligne
Le tableau de bord est votre panneau de décision en temps réel. Il résume le régime, la confiance et les conseils tactiques pour que vous n’ayez pas à deviner uniquement à partir de la ligne.
✅ État du modèle
Indique si le modèle fonctionne correctement.
- ACTIF = données valides disponibles et calculs corrects
- PAS DE DONNÉES = données du symbole manquantes, nom de symbole incorrect ou historique/alignement temporel insuffisant
🎯 Position Stratégique (Strategy Pos)
Une position suggérée basée sur le régime :
- LONG = Risk-On
- SHORT = Risk-Off
- NEUTRE = Neutre
⚠️ Niveau de risque
Une mesure de l’intensité du risque basée sur la volatilité et l’incertitude du marché.
- TRÈS BAS / BAS = conditions plus stables
- MOYEN = normal
- ÉLEVÉ / TRÈS ÉLEVÉ = bruit plus important, risque de retournement plus élevé ; réduire la taille ou exiger une confirmation plus forte
🧠 Sentiment du marché
Un ton directionnel dérivé du niveau du score :
- HAUSSIER / BAISSIER / NEUTRE
🌫️ Incertitude
Montre à quel point le modèle est « clair ». Elle augmente lorsque :
- la corrélation faiblit, ou
- la volatilité augmente (environnement plus instable)
Niveaux : FAIBLE / MODÉRÉ / ÉLEVÉ
🧪 Qualité du signal
Une évaluation combinée basée sur :
- la force du signal (distance par rapport à 50)
- le niveau d’incertitude
Résultats : FORT / FILTRÉ / FAIBLE
🔥 Régime de marché
La classification principale :
- Risk-On / Neutre / Risk-Off
C’est l’état de régime central qui pilote les superpositions colorées, les ombrages et le biais de position.
📉 Tendance
La direction à court terme du score (pente) :
- HAUSSIÈRE = appétit pour le risque en hausse
- BAISSIÈRE = appétit pour le risque en baisse
- NEUTRE = latéral / faible momentum
🗳️ Consensus (X/5)
Un score d’alignement simple qui compte combien de conditions clés sont en accord (direction, pente, alignement de corrélation, etc.).
Plus élevé = environnement plus clair et cohérent.
📏 Taille de position
Un pourcentage d’exposition suggéré basé sur la force du signal et l’incertitude :
- fort & faible incertitude → suggestion de taille plus élevée
- faible ou incertain → suggestion de taille plus petite
🧭 Avantage multi-échelles temporelles (très puissant en pratique)
Lorsque vous analysez le même marché sur plusieurs échelles temporelles, l’indicateur se met à jour et se réaligne par échelle. Cela facilite la détection de :
✅ Alignement des échelles temporelles (signaux plus forts)
✅ Conflit d’échelles temporelles (conditions souvent plus neutres/instables)
Les échelles temporelles supérieures définissent le régime macro, les échelles inférieures aident au timing des entrées à l’intérieur de ce régime.
📌 Marqueurs, alertes & notifications (fonctionnalités ULTRA)
✨ Marqueurs de régime s’affichent sur le graphique lorsque le régime change :
- Risk-On ↔ Neutre ↔ Risk-Off
Cela rend les transitions instantanément visibles.
🔔 Alertes & notifications peuvent être activées pour que vous receviez :
- alertes popup (et son optionnel)
- alertes à la clôture de la barre (recommandé pour éviter les déclenchements faux pendant la formation de la bougie)
💬 Rejoignez notre (optimisations + presets + outils)
Vous voulez la meilleure performance de cet indicateur ? Rejoignez notre Discord pour :
✅ optimisation des paramètres pour les symboles de votre courtier
✅ presets prêts à l’emploi (Crypto / Indices / FX)
✅ conseils pour la configuration multi-échelles temporelles
✅ outils avancés et mises à jour qui améliorent le filtrage des signaux et la qualité d’exécution
Résumé
Avis clients
5 | 100 % | |
4 | 0 % | |
3 | 0 % | |
2 | 0 % | |
1 | 0 % |


