Description
Brève description
Carte du régime de tendance et de volume est un filtre de régime pour cTrader qui mesure la direction et la persistance à la fois du prix et du volume. Il vous donne un score de tendance normalisé et un score de tendance de volume dans la plage –10 à +10, colore vos chandeliers avec un dégradé doux allant du rouge baissier au vert haussier, et montre si l'environnement actuel est en mode risque, hors risque, ou simplement bruyant.
🧠 Ce que cela fait
Cet indicateur reproduit la logique du « Filtre de régime » de BigBeluga sur TradingView, adapté pour cTrader et intégré dans une carte claire du régime de tendance et de volume.
Prix et volume lissés
- Calcule HLC3 (moyenne de Haut, Bas, Clôture) et applique une Moyenne Mobile de Hull (HMA) pour lisser le prix.
- Applique une autre Moyenne Mobile de Hull au volume des ticks.
Score de tendance (prix)
- Pour les N dernières barres (
Length), il compare la HMA actuelle du prix à chaque valeur HMA passée :
- Si HMA actuelle > HMA passée → tendance +1
- Si HMA actuelle ≤ HMA passée → tendance –1
- Le score accumulé est mis à l’échelle entre –10 … +10 → c’est la valeur de la tendance.
Score de tendance du volume
- Utilise la même logique, mais appliquée à la HMA du volume.
- Le résultat est un autre score normalisé dans –10 … +10 → la valeur du volume.
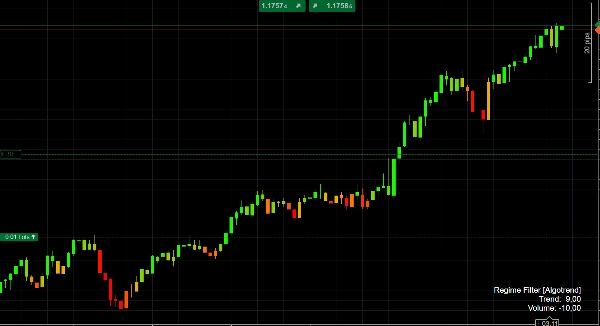
Logique des couleurs
- Lorsque le score de tendance est négatif, les chandeliers sont colorés avec un dégradé rouge → orange selon la force du régime baissier.
- Lorsque le score de tendance est positif, les chandeliers sont colorés orange → citron vert, avec un vert plus intense pour les régimes haussiers plus forts.
Cela vous donne un indice visuel instantané pour savoir si l’action des prix est baissière, neutre ou haussière, et à quel point ce régime est actuellement persistant.
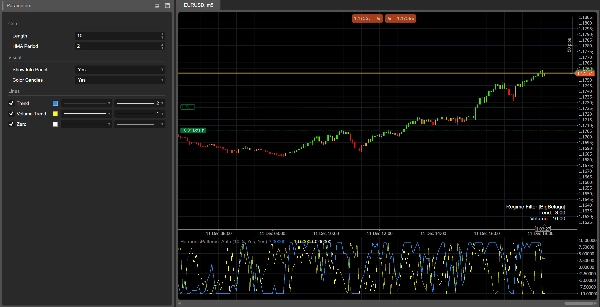
Panneau de régime
Dans la sous-fenêtre, l’indicateur trace :
- Ligne de tendance (bleue)
- Ligne de tendance du volume (grise)
- Ligne zéro (ligne de base)
Sur la dernière barre, il affiche un petit panneau d’information avec les valeurs actuelles de Tendance et Volume.
🎯 Comment vous pouvez l’utiliser
Confirmation de tendance
- Tradez uniquement dans la direction d’un régime fort, par exemple :
- Tendance > +4 → biais uniquement long
- Tendance < –4 → biais uniquement court
Filtre de régime
- Désactivez ou réduisez l’échelle de votre stratégie lorsque le régime est faible (Tendance proche de 0) ou lorsque la tendance du volume est fortement négative, ce qui signale souvent des mouvements erratiques ou en déclin.
Contexte pour les signaux
Combinez vos signaux d’entrée existants (action des prix, motifs harmoniques, oscillateurs, etc.) avec Carte du régime de tendance et de volume comme filtre macro :
- Ne prenez que les ruptures lorsque la Tendance est positive et que la tendance du Volume est également positive.
- Évitez les configurations de retour à la moyenne lorsque la Tendance est extrêmement forte (> +8 ou < –8), car le marché est dans un régime directionnel puissant.
⚙️ Paramètres d’entrée
Noyau
Longueur
Nombre de barres utilisées pour construire les scores de tendance et de volume.
- Valeurs plus élevées → régime plus lisse, plus « macro » ; plus lent à changer mais plus stable.
- Valeurs plus basses → réponse plus rapide, mais plus de bruit et de retournements fréquents.
Période HMA
Période de la Moyenne Mobile de Hull utilisée pour lisser à la fois le prix et le volume.
- Ajustez-la pour correspondre à votre unité de temps et style de trading : plus courte pour les unités de temps basses, plus longue pour les unités de temps élevées.
Visuel
Afficher le panneau d’info
Affiche/masque le petit panneau de texte sur la dernière barre avec les scores actuels de Tendance et Volume.Colorer les chandeliers
Active la coloration des chandeliers basée sur la valeur de la Tendance (dégradé rouge / orange / vert). Désactivez-la si vous préférez conserver les couleurs par défaut de votre graphique.
✅ Fiche d’interprétation rapide
- Tendance ≥ +7 → régime haussier fort, chandeliers vert vif.
- Tendance entre +3 et +7 → biais haussier ; les replis sont des zones potentielles d’achat.
- Tendance entre –3 et +3 → latéral / erratique ; les signaux sont moins fiables.
- Tendance ≤ –7 → régime baissier fort, chandeliers rouge foncé.
- Tendance du volume > 0 → activité en hausse / soutenue, les mouvements sont plus susceptibles d’être « réels » et persistants.
- Tendance du volume < 0 → participation en baisse, risque plus élevé de faux mouvements, de choppiness ou de retournements.
Résumé
Avis clients
5 | 0 % | |
4 | 100 % | |
3 | 0 % | |
2 | 0 % | |
1 | 0 % |


