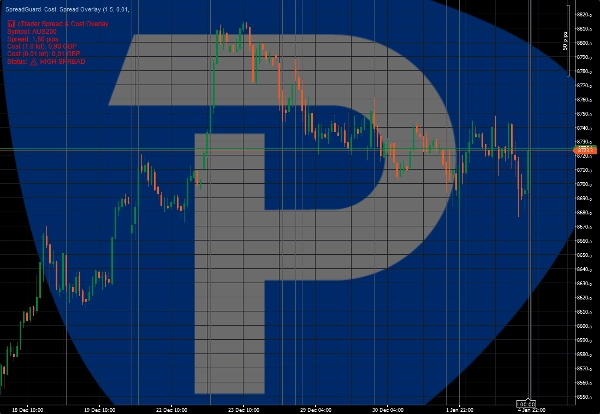
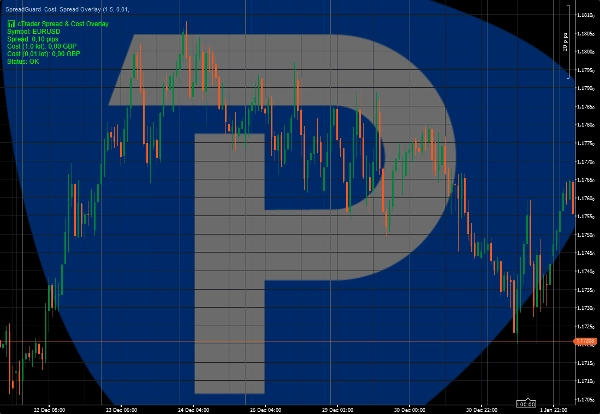
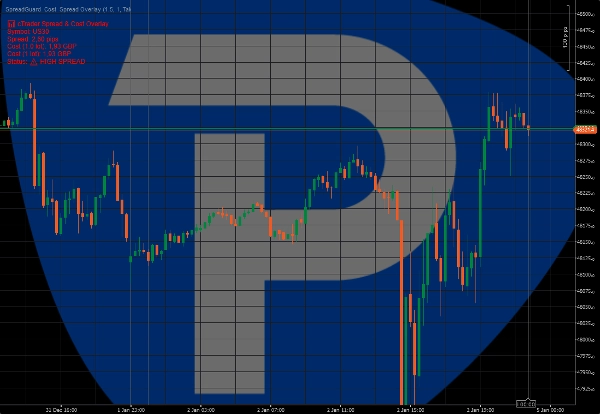
Logo de "SpreadGuard  Cost  Spread Overlay"
SpreadGuard Cost Spread Overlay
Image mise en ligne de "SpreadGuard  Cost  Spread Overlay"
Depuis le 02/01/2026

cTrader Spread & Cost Overlay is a lightweight indicator designed to visualize real-time trading costs directly on the chart.

The indicator shows the current spread in pips and calculates the estimated cost of a trade based on the selected lot size. A visual warning highlights periods of high spread, helping traders avoid unfavorable execution conditions.

Key features:
• Live spread display (pips)
• Estimated trade cost for selected lot size
• Visual warning when spread exceeds a defined threshold
• Clean on-chart overlay

This indicator does not place trades or generate trading signals.
It is intended as an execution and risk-awareness tool for manual traders.

Suitable for scalpers, intraday traders, and prop firm accounts.

*Early access price. Future updates may be released at a higher regular price.

Indicator profile
0.0
Avis : 0
Avis clients
Il n'y a pas encore d'avis sur ce produit. Vous l'avez déjà essayé ? Soyez le premier à en parler aux autres !
Prop
Forex
EURUSD
ATR
GBPUSD
Products available through cTrader Store, including trading bots, indicators and plugins, are provided by third-party developers and made available for informational and technical access purposes only. cTrader Store is not a broker and does not provide investment advice, personal recommendations or any guarantee of future performance.

Plus de cet auteur

Visual session structure showing Asia, London and New York high/low ranges directly on the chart.
Visual warning zones for high-impact news so you can manage risk before volatility hits.

Vous pourriez aussi aimer

Advanced price action tool that combines multiple technical analysis concepts
Trend-coloring Donchian cloud that highlights volatility squeezes and breakouts.
Automatically calculates the previous day’s high and low, determines the range, and then projects Fibonacci levels.
TECHNICAL ANALYSIS, WITH SOUND ALERT
Weis & Wyckoff System v2.0
The Volume-Weighted Edge: Improved RSI that can actually read the market moves.
Liquidity Pressure Index is a tool that gives traders deeper insights into the hidden dynamics of market liquidity
Enhance your trading strategy with our customizable TradingViewMACD indicator. Optimize and elevate your market analysis
Feather Gauge – Forex Sentiment Indicator The Feather Gauge is a visual sentiment indicator designed to represent marke
Time To Break Even Indicator. This indicator helps you time your trade's entry.
Market Sessions is very important for traders.
Track VWAP for Asia, London, NY, Sydney, Daily, Weekly, Monthly & Custom Sessions. Perfect for FX & intraday trading!
A custom support resistance indicator, specifically designed for scalping techniques.
Heikin Ashi (Heiken Ashi) - This indicator displays HeikinAshi candles.
Comprehensive SMC tool: swing & internal structure, Orderblock detection,equal highs/lows,premium/equilibrium/discount.
BoS ChoCH Pro,Strict Mode,False Breakout Filter,Average hit rate: 72-78%
A Clear Fibonacci Map for Smarter Decisions.
FBX VWAP Anchored — Professional VWAP
Depuis le 02/01/2026