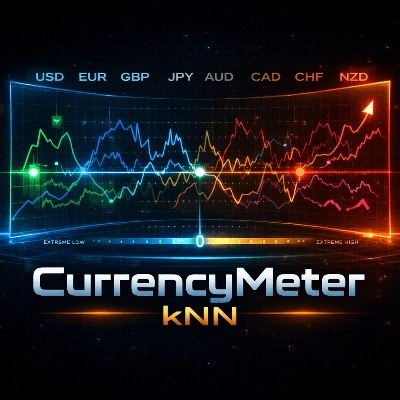
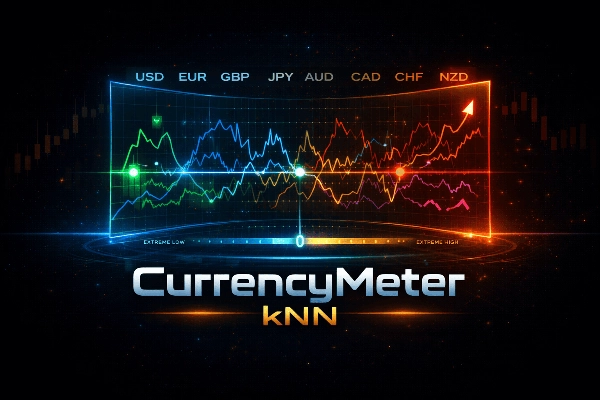
Description
CurrencyMeter kNN est un indicateur de force multi-devises conçu pour les traders qui souhaitent une vue claire des flux de devises, et une couche simple d'apprentissage automatique pour estimer la probabilité de retour à la moyenne.
Contrairement aux indicateurs classiques, il calcule la force pour les 8 principales devises (USD, EUR, GBP, JPY, AUD, CAD, CHF, NZD) en agrégeant les informations de toutes les paires, puis la normalise dans un indicateur compact. Il utilise des caractéristiques personnalisées (comme un % de rendement sur plusieurs périodes glissantes, et 5 autres qui resteront secrètes).
Comment ça fonctionne :
- Agrégation multi-paires : Pour chaque devise, l'indicateur agrège plusieurs caractéristiques de fenêtres glissantes qui se chevauchent. Cela produit une valeur moyenne de « pression sur la devise » par devise.
- Détection des extrêmes avec un seuil dynamique : Les marchés sont non stationnaires : les propriétés statistiques des prix/retours évoluent dans le temps (volatilité, liquidité, cycles macro, session). Un seuil fixe échoue souvent car ce qui est « extrême » dans un régime ne fonctionne plus dans un autre.
Pour réduire cette instabilité, le modèle utilise un seuil dynamique calculé à partir de la distribution récente de l'indicateur. Il estime « extrême » comme la queue supérieure des valeurs absolues récentes (basé sur un percentile). Cela transforme le signal brut en quelque chose de plus proche d'un comportement stationnaire, plus facile à modéliser et à apprendre pour le kNN.
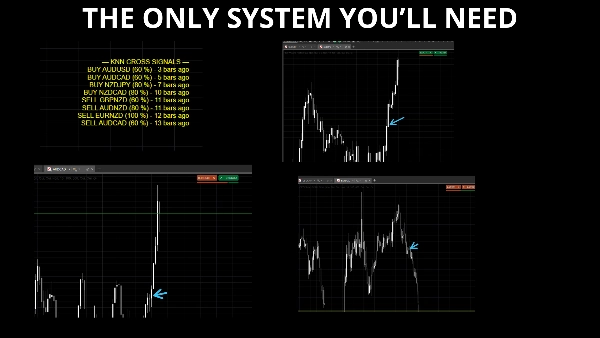
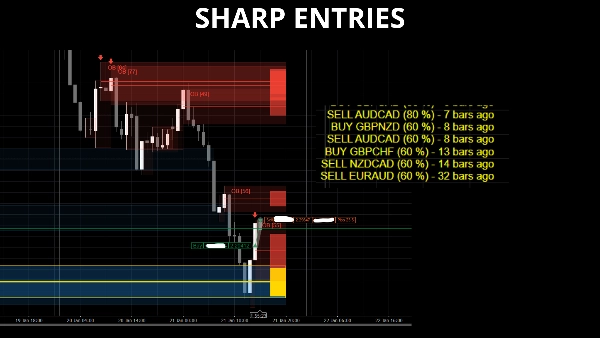
- Modèle kNN simple (ML transparent) : Un classificateur k-Nearest Neighbors (kNN) est utilisé pour estimer si une condition extrême tend à se rétablir sur un horizon défini.
Lorsque la probabilité dépasse le seuil de confiance, l'indicateur affiche une alerte directionnelle : ACHETER X/Y ou VENDRE X/Y.
Caractéristiques :
- 8 principales devises affichées dans un seul panneau
- Agrégation multi-paires
- Seuil dynamique « extrême » basé sur la distribution récente
- Couche de probabilité kNN pour le biais de retour à la moyenne
- Flèches persistantes sur le panneau pour les signaux récents
Notes :
- Il s'agit intentionnellement d'une approche ML simple et transparente (kNN). Ce n'est pas une boîte noire.
- L'objectif n'est pas la « prédiction » (qui est par définition impossible pour un trader de détail), mais la réaction : identifier quand une devise devient statistiquement étirée par rapport à son propre comportement récent.


![Logo de "[Stellar Strategies] Market Session Ultimate"](https://cdn.ctrader.com/image/webp/61ffd537-0125-4246-9e72-42eca1791d64_28232)