Description
🎯 Terminal d'exécution visuelle des risques FlowFX
L'interface visuelle ultime pour la gestion professionnelle des risques dans cTrader.
Arrêtez de calculer manuellement la taille des positions. Le Terminal d'exécution visuelle des risques FlowFX transforme votre graphique en un tableau de bord d'exécution interactif, vous permettant de définir vos trades visuellement en utilisant des lignes glissantes tandis que l'indicateur gère les calculs complexes en temps réel.
🚀 Fonctionnalités clés
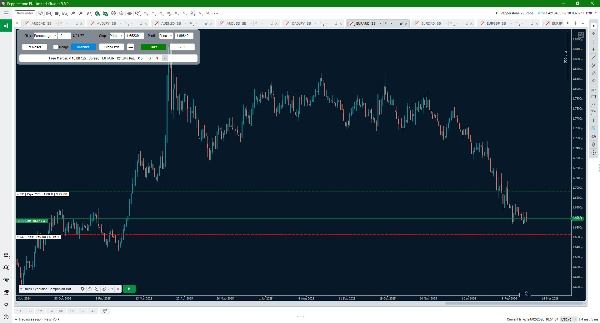
- Planification visuelle des trades : Cartographiez votre entrée, stop loss et take profit directement sur les chandeliers.
- Dimensionnement dynamique des lots : Calcule automatiquement le volume exact en fonction de votre solde de compte, de votre equity ou d'un montant fixe en espèces.
- Projection PnL : Voyez exactement combien vous pouvez gagner ou perdre dans la devise de votre compte avant de vous engager dans le trade.
- Mode de synchronisation par lots : Projetez une "ligne cible" sur le graphique pour voir comment déplacer vos sorties affectera le PnL cumulé de toutes les positions ouvertes.
- HUD haute technologie : Une interface utilisateur minimaliste et performante conçue par un ingénieur système senior pour ne pas gêner votre analyse de l'action des prix.
🤖 L'écosystème d'exécution
Pour convertir ces plans visuels en ordres en direct sans latence, cet indicateur s'associe parfaitement avec le Quick Execution Companion Bot. L'indicateur calcule "l'intention", et le bot compagnon gère "l'exécution".
🔗 Complétez votre suite :
Téléchargez le GRATUIT Quick Execution Companion Bot pour une exécution en un clic.
💬 Support & Feedback
Conçu pour la précision. Si vous avez des demandes de fonctionnalités ou trouvez un bug, améliorons ensemble le terminal, n'hésitez pas à nous contacter ! 🛠️
Arrêtez de deviner votre risque. Visualisez-le avec FlowFX. ⚡
Résumé
Avis clients
5 | 100 % | |
4 | 0 % | |
3 | 0 % | |
2 | 0 % | |
1 | 0 % |


