Description
Description
Trace automatiquement les niveaux de retracement de Fibonacci en utilisant la bougie précédente de n'importe quelle unité de temps sélectionnée — directement sur votre graphique. Aucun dessin manuel requis.
Comment ça fonctionne
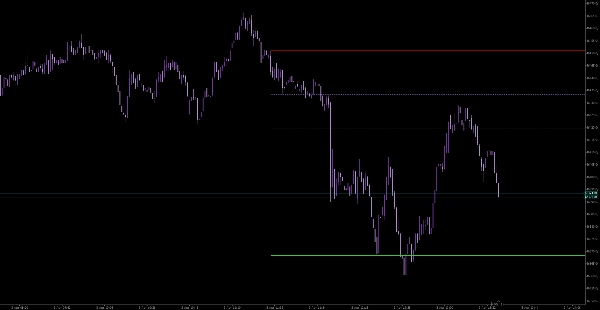
L'indicateur lit la dernière bougie clôturée de votre unité de temps choisie (1H, 4H, Daily, etc.) et trace quatre niveaux clés de Fibonacci sous forme de rayons étendus :
- 0% — Plus haut de la bougie (haussier) ou plus bas (baissier) ; origine de l'élan
- 61.8% — Zone de retracement initiale (repli léger)
- 78.6% — Zone de retracement profond (zone d'entrée précise)
- 100% — Retracement complet ; extrémité opposée de la bougie
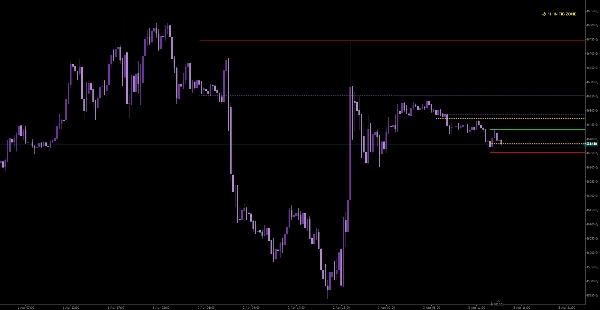
Détection intelligente de zone
La plage 61.8%–78.6% est considérée comme la zone de retracement premium.
Lorsque le prix entre dans cette zone, l'indicateur déclenche :
- Alerte à l'écran en temps réel
- Notification par email avec direction, unité de temps, prix et détails de la zone
Support multi-instance
Exécutez plusieurs instances sur le même graphique (par exemple, 1H, 4H, Daily) sans chevauchement ni conflit. Chaque instance fonctionne indépendamment avec un identifiant unique.
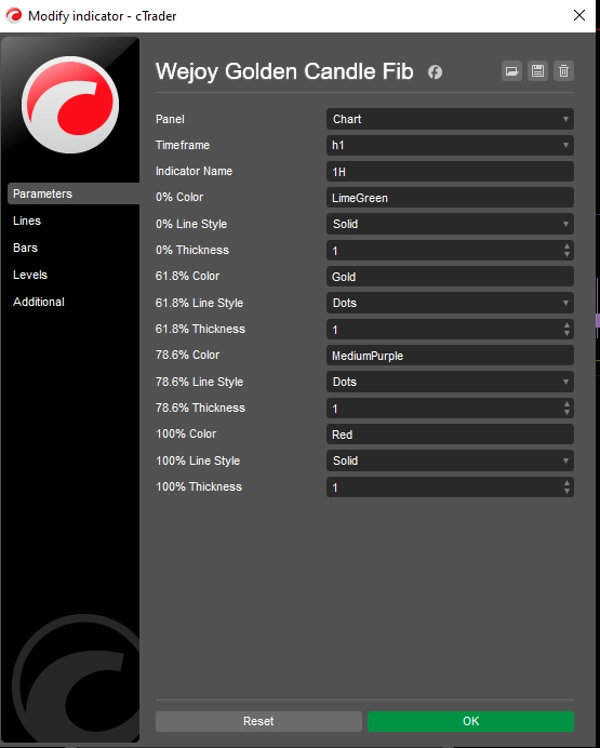
Personnalisation
Tous les niveaux de Fibonacci sont entièrement personnalisables :
- Couleur
- Style de ligne (plein, pointillé, tireté)
- Épaisseur de la ligne
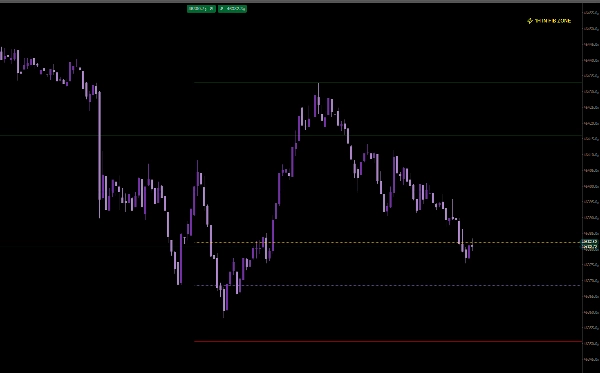
Meilleur usage avec
XAUUSD (Or), mais compatible avec tous les instruments et unités de temps.
Conçu pour
Les traders qui se concentrent sur des entrées précises, attendant que le prix retrace dans la zone dorée avant d'exécuter des transactions.


![Logo de "[Hamster-Coder] Pivot Points MTF"](https://cdn.ctrader.com/image/webp/4c143e5a-309c-40e3-a578-f04d1e133ffa_31159)