
WeSmCPro
Indicateur
333 téléchargements
Version 1.0, Apr 2026
Windows, Mac
Description
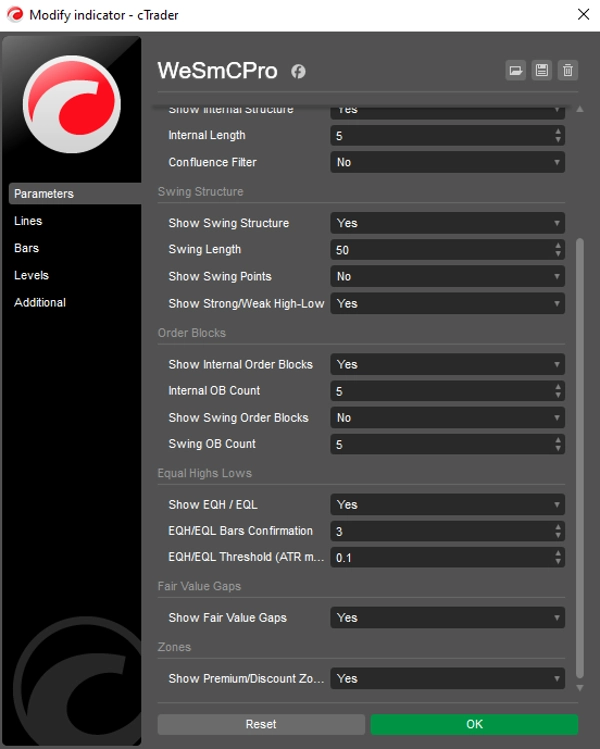
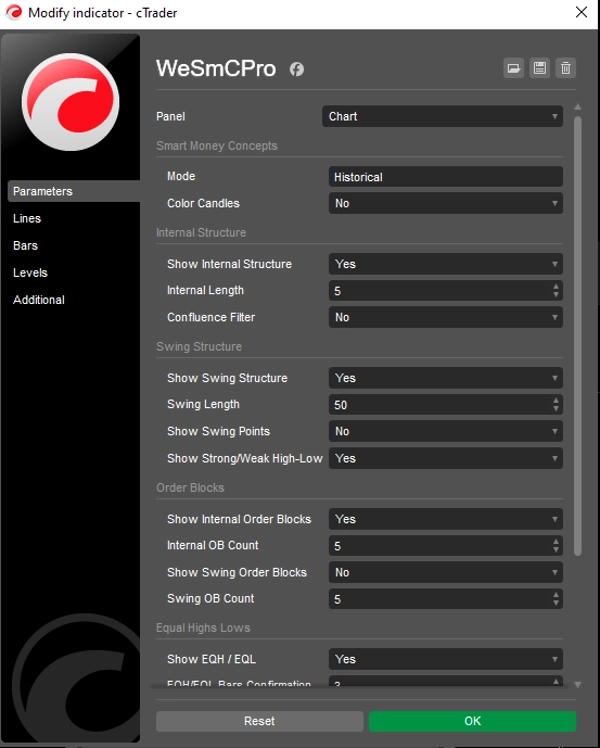
Cette liste présente les paramètres avancés et les fonctionnalités d'un indicateur de trading Smart Money Concepts (SMC). Il est conçu pour automatiser l'analyse technique de la structure du marché, de l'offre/demande et de la liquidité.
Voici une explication directe de ce que font ces paramètres :
🏗️ Structure du marché & Action des prix
- Mode (Historique/Présent) : Choisissez entre voir toutes les données passées (backtesting) ou uniquement la structure actuelle en direct pour garder votre graphique propre.
- Structure Interne vs. Swing : * Interne : Montre les cassures "mineures" (BOS/CHoCH) au sein d'une tendance.
-
- Swing : Montre les changements de tendance "majeurs" en utilisant des lignes pleines et des étiquettes plus grandes.
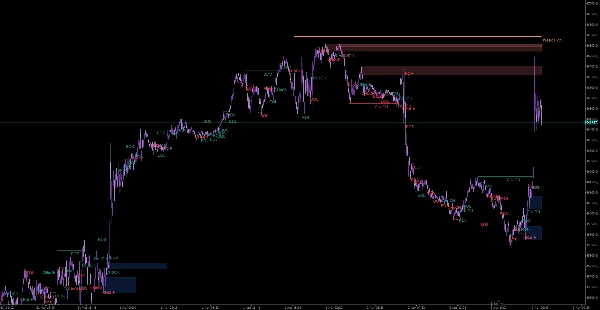
- Points Swing : Étiquette automatiquement les Hauts et Bas (HH, HL, LH, LL) pour que vous n'ayez pas à identifier manuellement la tendance.
- Hauts & Bas Égaux (EQH/EQL) : Identifie un support/résistance "retail" potentiel où se trouve généralement la liquidité institutionnelle. Le paramètre Bars Confirmation filtre les faux hauts/bas égaux.
🧱 Offre, Demande & Déséquilibre
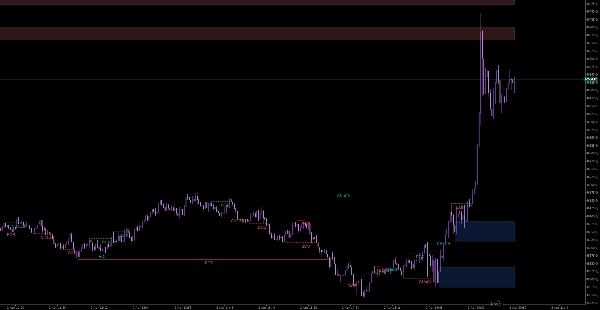
- Blocs d'Ordres (Interne & Swing) : Met en évidence la "dernière bougie" avant un grand mouvement où les institutions ont probablement des ordres en attente. Vous pouvez limiter le nombre affiché pour éviter l'encombrement.
- Fair Value Gaps (FVG) : Met en évidence les déséquilibres de prix (écarts).
-
- Seuil Automatique : Filtre les écarts minuscules et insignifiants.
- Période : Vous permet de voir les FVG d'une période supérieure tout en restant sur votre graphique actuel.
- Étendre FVG : Projette l'écart vers l'avant pour que vous puissiez voir quand le prix y revient finalement.
📊 Contexte & Confluence
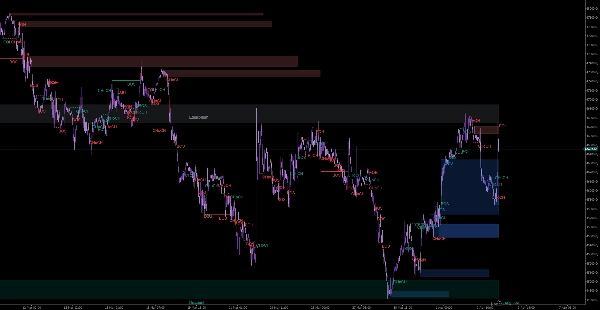
- Hauts & Bas MTF : Trace les hauts/bas précédents journaliers, hebdomadaires et mensuels. Ce sont des niveaux "aimant" où le prix réagit souvent.
- Zones Premium/Discount : Divise une plage de trading en trois parties :
-
- Premium : Le prix est cher (cherchez des ventes).
- Équilibre : Valeur équitable.
- Discount : Le prix est bon marché (cherchez des achats).
- Filtre de Confluence : Un bouton "intelligent" qui cache les cassures de structure faibles, ne vous montrant que les mouvements ayant un fort momentum ou volume derrière eux.
Résumé
Résumé IA
WeSmCPro is a Smart Money Concepts (SMC) trading indicator designed to automate technical analysis by identifying market structure, supply and demand zones, and liquidity areas. It offers two modes: Historical for backtesting and Present for live market structure visualization. The indicator distinguishes between internal (minor) and swing (major) trend structures, automatically labeling swing points such as higher highs, higher lows, lower highs, and lower lows.
Key features include detection of equal highs and lows to identify potential retail support and resistance zones, with filters to reduce false signals. It highlights order blocks—candles preceding significant moves where institutional orders may rest—and fair value gaps (price imbalances), with options to filter insignificant gaps, view higher timeframe gaps on the current chart, and extend gaps forward for tracking price return.
For broader context, WeSmCPro plots multi-timeframe daily, weekly, and monthly highs and lows, which often act as price magnets. It divides trading ranges into premium (expensive), equilibrium (fair value), and discount (cheap) zones to assist in identifying potential sell or buy areas. A confluence filter helps focus on strong structure breaks supported by momentum or volume. The indicator supports various markets including Forex, cryptocurrencies, indices, commodities, and stocks.
Profil de l'indicateur
Avis clients
0.0
Avis : 0
Avis clients
Il n'y a pas encore d'avis sur ce produit. Vous l'avez déjà essayé ? Soyez le premier à en parler aux autres !
Discussion
Questions fréquentes
BTCUSD
Forex
Signal
Breakout
Indices
EURUSD
Commodities
GBPUSD
NZDUSD
Martingale
Prop
Scalping
SMC
Crypto
Grid
Stocks
AI
XAUUSD
NAS100
USDJPY
Les produits disponibles sur cTrader Store, notamment les bots de trading, les indicateurs et les plug-ins, sont fournis par des développeurs tiers et mis à disposition à titre informatif et à des fins d'accès technique uniquement. cTrader Store n'est pas un courtier et ne fournit aucun conseil en investissement, aucune recommandation personnelle ni aucune garantie quant aux performances futures.
Plus de cet auteur


Prix
2.84K
Installations gratuites