Description
My affiliate link Impact/cTrader https://ctraderltd.pxf.io/c/7067705/3835381/43990
EXCLUSIVE PRICE DISCOUNT - LIMITED AVAILABILITY
Professional XAUUSD market regime indicator now at accessible pricing. Same multi-timeframe analysis, same comprehensive dashboard, better access for serious gold traders.
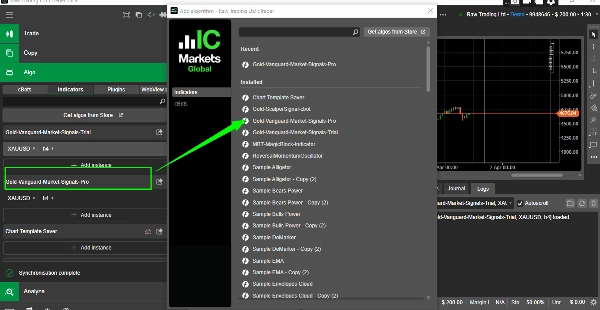
GOLD-VANGUARD-MARKET-SIGNALS-PRO
Professional XAUUSD Market Regime & Bias Indicator
Part of the SAL-FAMILY-EXCLUSIVE Series
A specialized multi-timeframe XAUUSD market bias indicator combining EMA alignment, slope analysis, ADX strength, ATR regime, and Bollinger compression logic. Classifies gold market conditions into three practical outputs: BUY ONLY, SELL ONLY, or BOTH/RANGE - helping traders avoid trading blindly in unfavorable market regimes.
TRUST SIGNALS
- 4.0/5 Rating (3 verified reviews)
- 100% 4-star reviews
- Verified Seller (Sumsub)
- Specialized for XAUUSD/Gold
- Multi-Timeframe Analysis (H1, H4, D1, W1)
- Trial Version Available
- Part of SAL-FAMILY-EXCLUSIVE Series
INDICATOR PROFILE (Verified by cTrader)
Indicator Category: Trend
Output Type: Visualisation
Data Requirements: Tick data
Supported Signals: Trend strength, Volatility
WHAT VERIFIED CUSTOMERS SAY (4.0/5 RATING)
4 stars - DeltaNeutral99 (April 17, 2026):
"Kinda useful if you already have rules. If you expect it to magically print entries, you will probably be disappointed. The first forward check feels cleaner once the trade size stays small."
4 stars - MartingaleMind (April 14, 2026):
"Pretty decent as a helper. Not perfect, but it made gold trading easier to read and a demo run should cover it for a few more sessions. A follow up check on it in 1 month."
4 stars - GridBotCommander (April 10, 2026):
"Ngl, this one makes sense if you are not trying to yolo every signal. It works with it on demo first and see how it behaves when XAUUSD volatility gets messy. The part to watch is whether bad trades cluster too quickly."
WHAT THIS INDICATOR DOES
Analyzes XAUUSD market structure across H1, H4, D1, and W1 timeframes to classify current conditions into three clear outputs:
- BUY ONLY: Strong bullish higher-timeframe alignment
- SELL ONLY: Strong bearish higher-timeframe alignment
- BOTH/RANGE: Mixed, weak, or compressing conditions
Rather than acting as a simple entry trigger, this is a higher-level market guidance tool that helps traders understand whether conditions favor bullish continuation, bearish continuation, or mixed/ranging behavior.
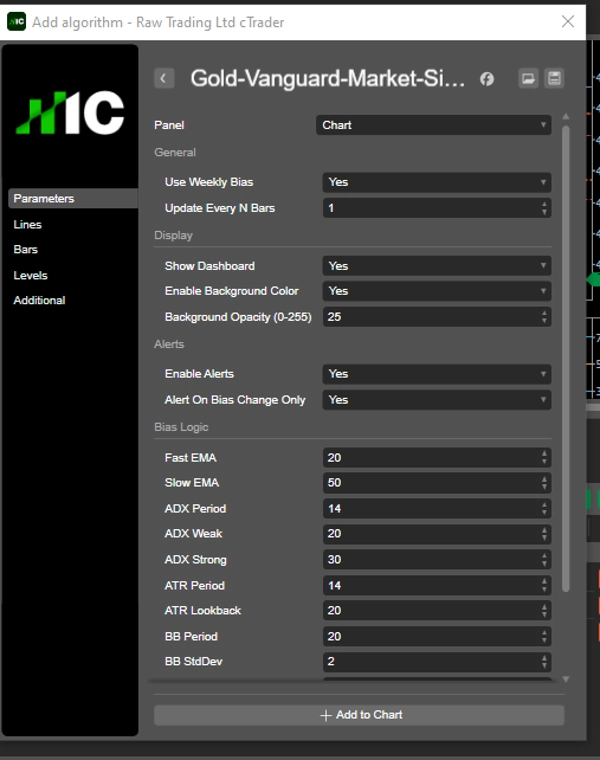
HOW IT WORKS
Uses a weighted scoring model across H1, H4, D1, W1 timeframes evaluating: EMA alignment, EMA slope, ADX trend strength, ATR expansion/contraction, Bollinger Band compression, and cross-timeframe agreement/conflict. This estimates not only direction but whether the market is trending, weakening, compressing, or rotating.
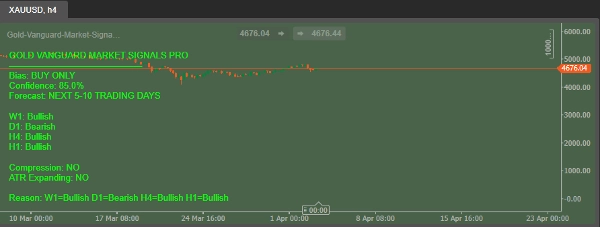
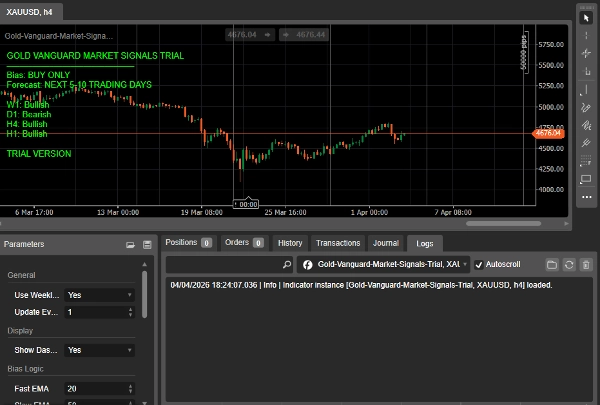
MAIN OUTPUTS - DASHBOARD DISPLAYS
- Current market bias (BUY ONLY / SELL ONLY / BOTH-RANGE)
- Confidence percentage
- Forecast horizon
- W1 trend state
- D1 trend state
- H4 trend state
- H1 trend state
- Compression status
- ATR expansion status
- Reason summary
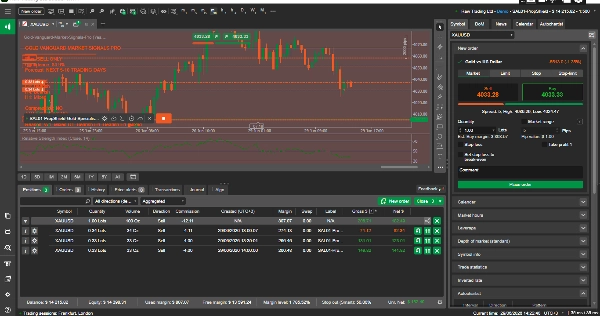
VISUAL DESIGN
Full on-chart dashboard with optional background color mode (Green = bullish bias, Red = bearish bias, Gold = mixed/range) and optional alerts on bias change. Designed for quick visual interpretation of current gold market state.
PRO VERSION FEATURES
Confidence percentage, full dashboard detail, background color mode, bias change alerts, full regime and reason summary, expanded display, full customization options.
RECOMMENDED USAGE
Can attach to any chart timeframe, but internal logic is based on higher-timeframe structure. Recommended chart timeframes for best interpretation: H4 and H1. Not designed as a low-timeframe scalping signal indicator.
WHO THIS IS FOR
Manual XAUUSD traders, swing traders, intra-day traders using higher-timeframe bias, analysts, cBot users wanting directional filter, system developers working on gold strategies, and traders who want to avoid trading blindly in wrong market regimes.
PRACTICAL BENEFITS
- Filter long trades during bearish conditions
- Filter short trades during bullish conditions
- Identify mixed/ranging periods clearly
- Spot transition phases between trend and range
- Combine higher-timeframe structure with your entry method
- Reduce emotional decision-making with structured framework
.
WHAT IS INCLUDED
Full Gold-Vanguard-Market-Signals-Pro indicator, multi-timeframe analysis engine, complete dashboard display, customizable parameters, setup guidance, lifetime updates, priority developer support, free future upgrades, direct developer communication, active discussion channel support.
ENTRY POINT TO SAL-FAMILY-EXCLUSIVE
This indicator is your gateway to the complete SAL-FAMILY trading ecosystem. Explore our premium cBots:
Top Performer: SAL-V03-Gold-CMA-Pro - #1 Ranked, +256% Live ROI
Prop Firm: SAL01-PropShield-Gold-Specialist-Pro
Conservative Grid: SafeGrid-Gold-Vanguard-Pro - +48% ROI
Dual-Directional Gold: Gold-Compression-Surge-Pro - +43% ROI
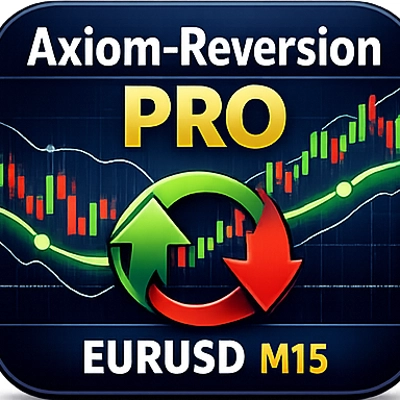
Mean Reversion Forex: Axiom-Reversion-Pro
Mean Reversion Gold: SAL-V03-Gold-Reversion-Pro
Optimized Trend: SAL-02-Max-CMA-Gold-250-Full-Optimized
Aggressive Gold: SAL-04-GOLD-TF-ULTRARISK-PRO
JPY Volatility: V5-VOLATILITY-PAIRS-FX-FUSION-PRO
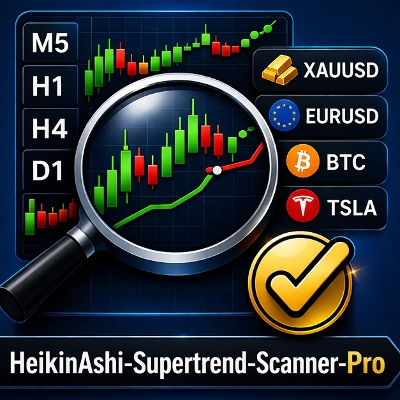
Companion Indicator: HeikinAshi-Supertrend-Scanner-Pro
Visit the SAL-FAMILY-EXCLUSIVE seller profile for the complete lineup.
FAQ
What does the indicator show?
Classifies XAUUSD market into BUY ONLY, SELL ONLY, or BOTH/RANGE plus confidence percentage, forecast horizon, W1/D1/H4/H1 trend states, compression status, ATR expansion status, and reason summary.
What symbol is it designed for?
Specifically XAUUSD (Gold).
Does it work on any timeframe?
Yes, but recommended chart timeframes for interpretation are H4 and H1 since internal logic uses higher-timeframe structure.
Is it an entry indicator?
No. It is a market bias and regime indicator, not a direct entry trigger.
What timeframes does it analyze internally?
H1, H4, D1, and W1.
What does the confidence percentage mean?
Reflects the relative strength of internal multi-timeframe directional scoring to estimate how strongly current conditions support the displayed bias.
What does the forecast horizon mean?
Estimated near-term bias window based on current market structure and alignment strength. Not a guarantee.
Can I use it with my own strategy?
Yes. Designed as a general-purpose gold market bias tool compatible with manual trading, other indicators, or automated systems.
Does it guarantee future direction?
No. Estimates current and near-term bias using technical structure only.
What is the difference between Trial and Pro?
Trial limited to EURUSD M1 with basic features. Pro adds confidence percentage, full dashboard, background color mode, bias change alerts, expanded regime summary, advanced customization.
DEVELOPER NOTE
Gold-Vanguard-Market-Signals-Pro combines EMA structure, trend strength, volatility regime, and compression analysis into a clear visual dashboard with optional alerts, background color mode, confidence scoring, and higher-timeframe context. It offers a practical, professional way to improve directional awareness in gold trading.
If you want clearer understanding of whether gold currently favors buying, selling, or standing aside, this indicator is designed for exactly that purpose.
IMPORTANT NOTE
This is a market guidance tool, not a profit guarantee. It estimates current market bias and likely near-term regime using technical structure analysis. It does not predict geopolitical events, macroeconomic surprises, or execution anomalies.
RISK DISCLOSURE
This indicator is a market analysis tool only. Trading involves substantial risk of loss. Past performance does not guarantee future results. Users are responsible for their own trading decisions, risk management, position sizing, and strategy execution.
KEYWORDS
cTrader Indicator, Gold Indicator, XAUUSD Indicator, Multi-Timeframe Indicator, Market Regime Tool, Trend Bias Indicator, EMA ADX Indicator, Bollinger Bands, ATR Indicator, Volatility Indicator, Gold Market Analysis, H4 H1 D1 W1 Analysis, Trend Strength Indicator, Compression Indicator, Confluence Indicator, Trading Dashboard, SAL-FAMILY-EXCLUSIVE.
Trade smart. Trade informed. Trade responsibly.
Salieh - SAL-FAMILY-EXCLUSIVE Series
Résumé
The on-chart dashboard visually displays current market bias with optional background color coding (green for bullish, red for bearish, gold for mixed/range), confidence percentage, forecast horizon, individual timeframe trend states, compression and ATR expansion status, and a reason summary. Alerts on bias changes and full customization options are included in the Pro version.
Recommended for manual XAUUSD traders, swing and intraday traders using higher-timeframe bias, system developers, and cBot users, this tool helps filter trades according to prevailing market regimes, identify ranging periods, and reduce emotional decision-making. It supports tick data input and outputs trend strength and volatility signals. The indicator is part of the SAL-FAMILY-EXCLUSIVE series and includes lifetime updates and developer support.
Avis clients
5 | 0 % | |
4 | 100 % | |
3 | 0 % | |
2 | 0 % | |
1 | 0 % |