

Description
━━━━━━━━━━━━━━━━━━━━━━━━━━━━━━━━━━━━━━━━
Panneau de biais HTF — Biais
━━━━━━━━━━━━━━━━━━━━━━━━━━━━━━━━━━━━━━━━
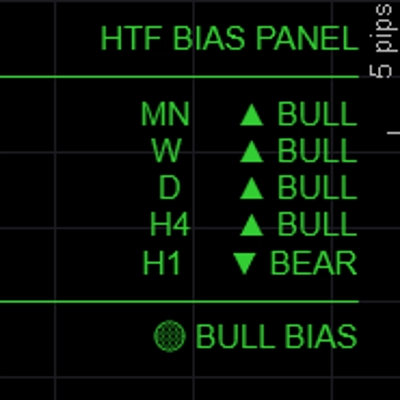
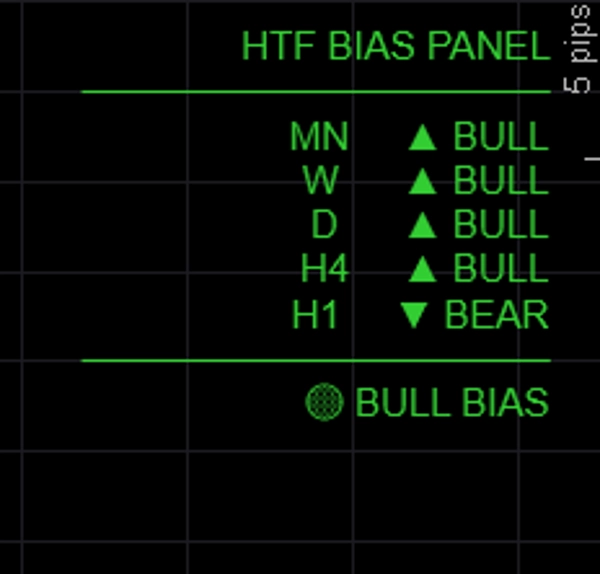
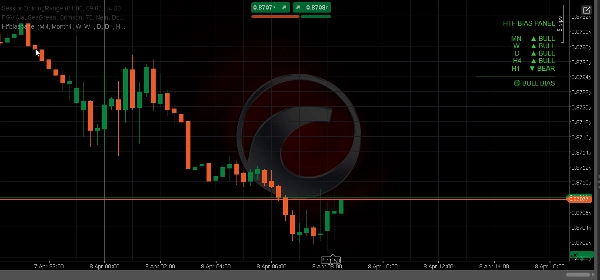
Affiche le biais directionnel pour jusqu'à cinq périodes simultanément dans un panneau propre sur le graphique — pour que vous sachiez toujours si les périodes supérieures sont haussières, baissières ou mixtes avant d'entrer en position.
─────────────────────────────
FONCTIONNALITÉS CLÉS
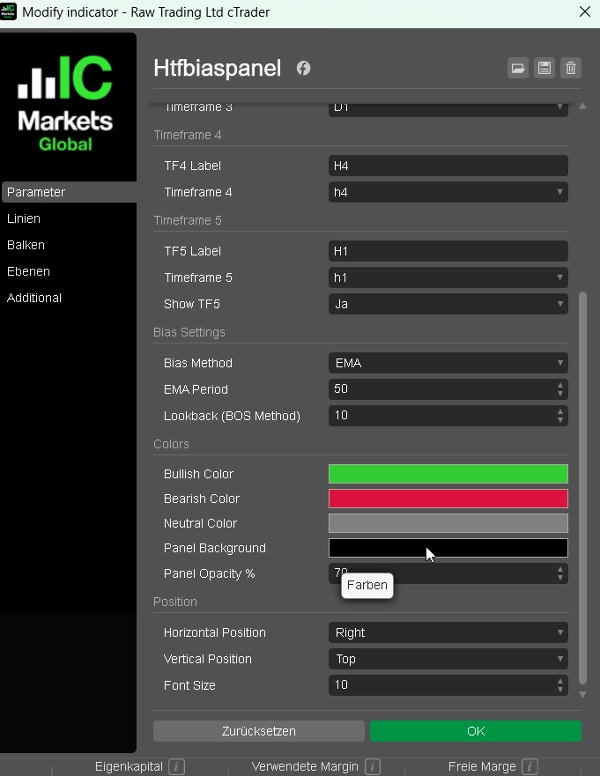
► 5 périodes entièrement configurables — par défaut MN / W / D / H4 / H1, toutes les étiquettes et TF personnalisables
► Trois méthodes de biais — choisissez comment le biais est déterminé par session :
• EMA : clôture au-dessus/en dessous de EMA(50) → la plus fiable pour le suivi de tendance
• Prix vs Dernière clôture : clôture actuelle vs clôture précédente → réactif, basé sur le momentum
• BOS : plage récente vs plage antérieure → biais basé sur la structure
► Résumé d'alignement — BULL COMPLET / BEAR COMPLET / BIAIS HAUSSIER / BIAIS BAISSIER / NEUTRE affiché en bas du panneau
► Sortie codée par couleur — vert pour haussier, rouge pour baissier, gris pour neutre
► Position du panneau — placez en haut à gauche, en haut à droite, au centre en haut, en bas à gauche ou en bas à droite
► Couleurs entièrement personnalisables pour les états haussier, baissier et neutre
► Léger — pas de dessins sur le graphique, pas de rectangles, pas de surcharge
─────────────────────────────
EXPLICATION DES MÉTHODES DE BIAIS
→ EMA (par défaut) : haussier si clôture > EMA(période). Le plus stable, ignore le bruit à court terme.
→ Prix vs Dernière clôture : haussier si la clôture de la barre actuelle > clôture de la barre précédente. Rapide et réactif.
→ BOS : compare la plage récente de N barres à la plage antérieure de N barres. Haussier si plus hauts plus hauts et plus bas plus hauts.
─────────────────────────────
PARAMÈTRES PAR DÉFAUT
→ TF1 Mensuel (MN)
→ TF2 Hebdomadaire (W)
→ TF3 Quotidien (D)
→ TF4 H4
→ TF5 H1 (activable)
→ Méthode de biais EMA
→ Période EMA 50
→ Couleur haussier LimeGreen
→ Couleur baissier Crimson
→ Position Haut Gauche
─────────────────────────────
COMMENT UTILISER
1. Ajoutez le panneau à n'importe quel graphique
2. Choisissez votre méthode de biais préférée (EMA recommandée pour les débutants)
3. Vérifiez le résumé d'alignement avant d'entrer en position — ne prenez des positions longues que lorsque BIAIS HAUSSIER ou BULL COMPLET
4. Utilisez le biais HTF pour filtrer les signaux de votre indicateur BOS/CHoCH ou FVG — ne tradez que dans la direction confirmée par le panneau
5. Ajustez les périodes pour correspondre à votre style de trading (par exemple D / H4 / H1 / M15 / M5 pour les scalpers)
─────────────────────────────
IDÉAL POUR
✔ Traders ICT et Smart Money Concepts ayant besoin d'une analyse rapide de haut en bas
✔ Traders multi-périodes qui veulent une vérification visuelle rapide du biais
✔ Traders FTMO et prop firm qui doivent trader avec confluence
✔ Tout trader souhaitant éviter de trader contre la tendance des périodes supérieures
✔ Traders Forex, Or, Indices et CFD Crypto
─────────────────────────────
COMPATIBILITÉ
→ Plateforme cTrader (Bureau & Web)
→ Classes d'actifs Forex, Indices, Matières premières, CFD Crypto
→ Périodes Toutes (M1 à MN)
→ Droits d'accès Aucun requis
→ Type de compte Live & Démo
━━━━━━━━━━━━━━━━━━━━━━━━━━━━━━━━━━━━━━━━
Résumé
Avis clients
5 | 67 % | |
4 | 33 % | |
3 | 0 % | |
2 | 0 % | |
1 | 0 % |


















![Logo de "High-Low Divergence [Iridio Capital]"](https://cdn.ctrader.com/image/webp/10a9e91b-243a-43f6-bbfe-7376bad5a214_61554)




![Logo de "[Hamster-Coder] Pivot Points MTF"](https://cdn.ctrader.com/image/webp/4c143e5a-309c-40e3-a578-f04d1e133ffa_31159)


