MAMA CANDLES
Indicateur
Version 1.0, Sep 2024
Windows, Mac
4.5
Avis : 2
Description
Ce code implémente l'indicateur MESA Adaptive Moving Average (MAMA) indicateur, un filtre adaptatif complexe conçu pour répondre aux cycles et lisser les données de prix. Voici une répartition de ses principales caractéristiques :
Éléments clés :
- Transformée de Hilbert : L'indicateur utilise une transformée de Hilbert pour calculer la phase et la période du cycle dominant de la série de prix, ce qui aide à identifier le cycle du marché.
- MAMA & FAMA adaptatifs :
-
- MAMA est la moyenne mobile plus rapide qui s'adapte au cycle dominant.
- FAMA est la moyenne plus lisse et plus lente.
- Les deux sont tracés sur le graphique en utilisant des couleurs différentes.
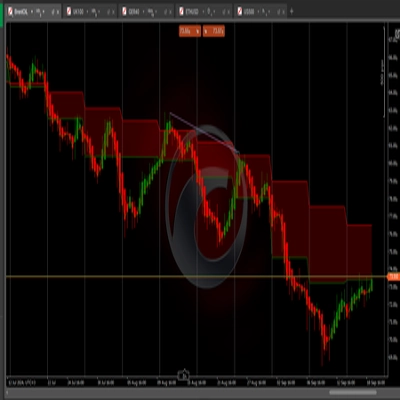
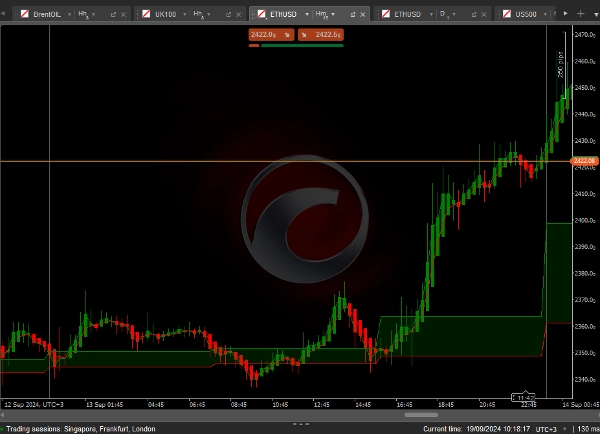
- Coloration personnalisée des chandeliers :
-
- Les chandeliers sont colorés en vert lorsque MAMA est au-dessus de FAMA (condition haussière).
- Ils sont colorés en rouge lorsque MAMA est en dessous de FAMA (condition baissière).
Résumé
Profil de l'indicateur
Avis clients
4.5
Avis : 2
5 | 50 % | |
4 | 50 % | |
3 | 0 % | |
2 | 0 % | |
1 | 0 % |
Discussion
Questions fréquentes
Les produits disponibles sur cTrader Store, notamment les bots de trading, les indicateurs et les plug-ins, sont fournis par des développeurs tiers et mis à disposition à titre informatif et à des fins d'accès technique uniquement. cTrader Store n'est pas un courtier et ne fournit aucun conseil en investissement, aucune recommandation personnelle ni aucune garantie quant aux performances futures.
Plus de cet auteur


![Logo de "Wyckoff Toolkit [Iridio Capital]"](https://cdn.ctrader.com/image/webp/8acfe6a1-6a8e-4578-9367-9df3af2b1801_27763)


Prix
Depuis le 19/09/2024
314.61K
Volume tradé
258.47K
Pips gagnés
536
Installations gratuites