

Mô tả
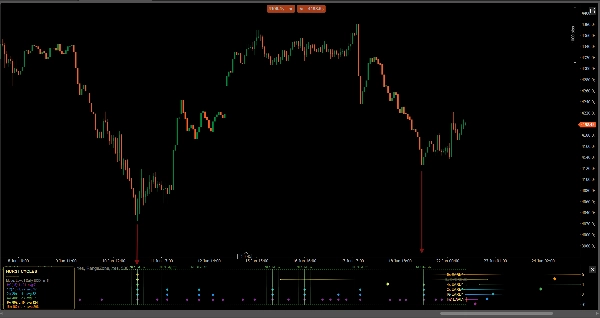
MTC Hurst Cycle Akademica lập bản đồ cấu trúc chu kỳ của bất kỳ thị trường nào, từng tầng một, trong một khung phụ riêng biệt. Được xây dựng dựa trên mô hình thị trường chu kỳ của J. M. Hurst, nó đánh dấu các đáy chu kỳ đã được xác nhận (và tùy chọn là đỉnh) của mỗi tầng chu kỳ được bật dưới dạng các viên kim cương mã màu, dự báo thời điểm đáy chu kỳ tiếp theo dự kiến, và làm nổi bật "Tổ Đáy" — các thanh nơi nhiều đáy chu kỳ dự kiến trùng nhau, bối cảnh chuyển đổi xác suất cao kinh điển của Hurst.
TÍNH NĂNG CHÍNH
• 7 tầng chu kỳ lồng nhau (HC, 1C, 2x, 4x, 8x, 16x, 32x) — bật bất kỳ kết hợp nào.
• Chỉ kim cương đã xác nhận — các dấu hiệu gần đây nhất KHÔNG vẽ lại trên thanh trực tiếp.
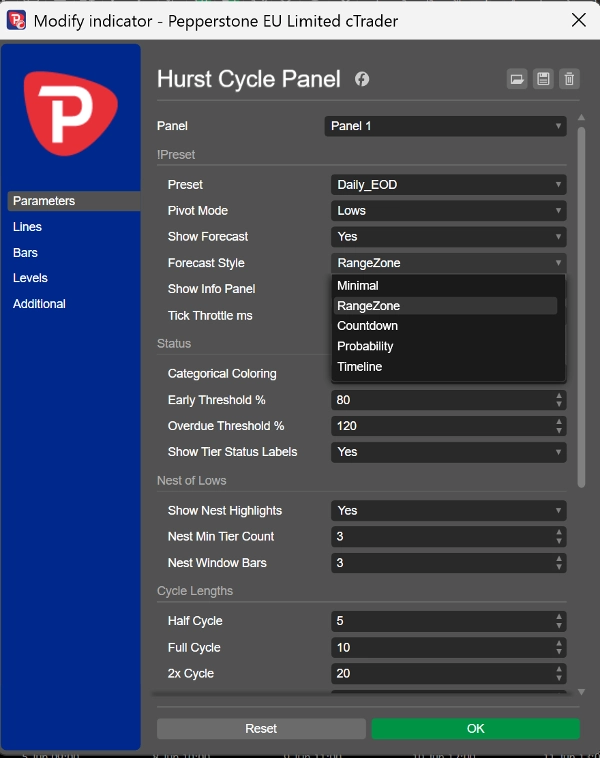
• Dự báo đáy tiếp theo với 5 kiểu hiển thị: Tối giản, Vùng phạm vi, Đếm ngược, Xác suất (1σ / 2σ), Dòng thời gian.
• Làm nổi bật "Tổ Đáy", tự động điều chỉnh theo độ dài chu kỳ được bật.
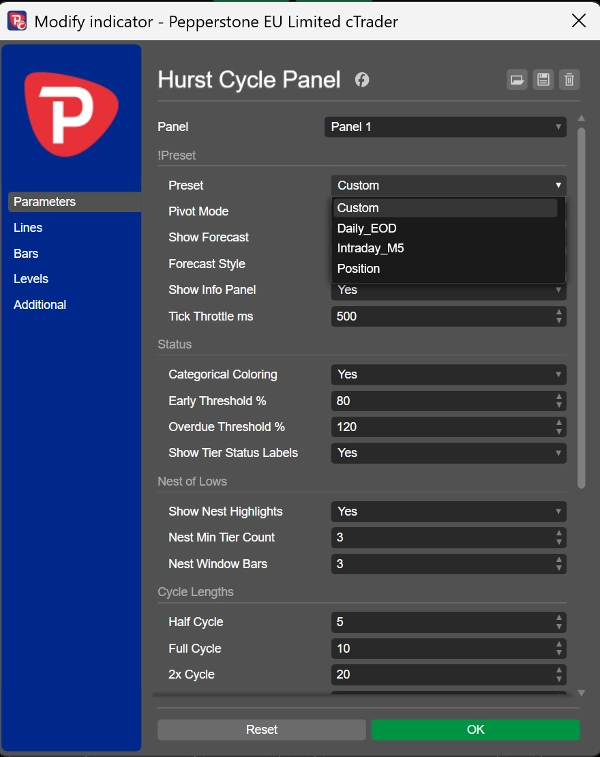
• Cài đặt sẵn một lần nhấp: EOD hàng ngày, Intraday M5, Vị trí — hoặc độ dài chu kỳ tùy chỉnh hoàn toàn.
• Bảng thông tin hiện đại trên biểu đồ: đếm pivot theo từng tầng, độ dài chu kỳ trung bình đo được (chỉ hiển thị khi có ý nghĩa thống kê), và kiểm tra tỷ lệ hài hòa.
• Chế độ pivot: Đáy, Đỉnh hoặc Cả hai.
• Tỷ lệ tự điều chỉnh, hiển thị sạch và không nhấp nháy.
CÁCH SỬ DỤNG
Thêm nó bên dưới biểu đồ giá của bạn. Đọc các viên kim cương thấp nhất và điểm nhấn "Tổ" như xương sống thời gian chu kỳ của thị trường, và sử dụng dự báo để dự đoán cửa sổ thời gian của lần quay tiếp theo. Nó kết hợp tự nhiên với MTC Hurst FLD Akademica (mức giá) và MTC Hurst Pulse Akademica (bộ dao động độ trưởng thành chu kỳ).
HOẠT ĐỘNG TRÊN
Bất kỳ ký hiệu và bất kỳ khung thời gian nào.
TỪ CHỐI TRÁCH NHIỆM
Đây là công cụ phân tích kỹ thuật và trực quan hóa dựa trên lý thuyết thị trường chu kỳ của J. M. Hurst. Nó không đặt lệnh và không đảm bảo hiệu suất, độ chính xác hay lợi nhuận. Phân tích chu kỳ mang tính xác suất và các dự báo tương lai là ước tính, không phải dự đoán. Luôn áp dụng quản lý rủi ro và phán đoán của riêng bạn. Hành vi thị trường trong quá khứ không đảm bảo kết quả tương lai.
Tóm tắt
Key features include seven nested cycle tiers (HC, 1C, 2x, 4x, 8x, 16x, 32x) with customizable combinations, one-click presets for common timeframes (Daily EOD, Intraday M5, Position), and a modern on-chart info panel showing pivot counts, average cycle length, and harmonic-ratio checks. Users can select pivot modes (Lows, Highs, or Both) and benefit from auto-fitting scale and flicker-free rendering.
The panel works on any symbol and timeframe and is intended as a visualization tool to aid cycle timing analysis. It complements other Hurst-based tools for price levels and cycle maturity oscillation.




![Logo "High-Low Divergence [Iridio Capital]"](https://cdn.ctrader.com/image/webp/10a9e91b-243a-43f6-bbfe-7376bad5a214_61554)















