

Description
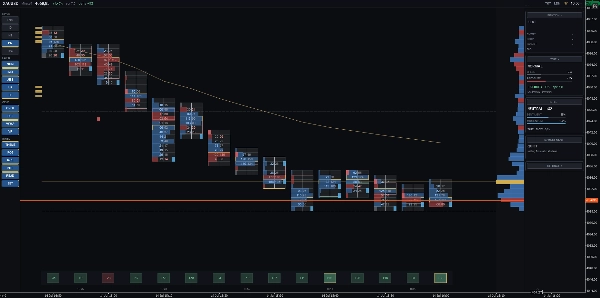
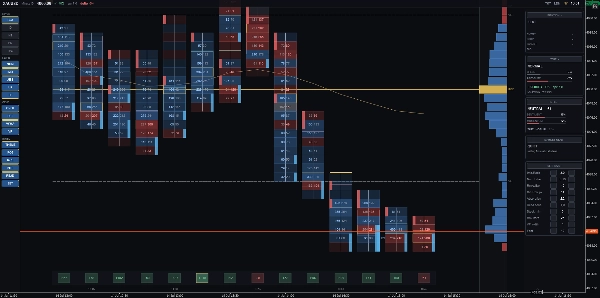
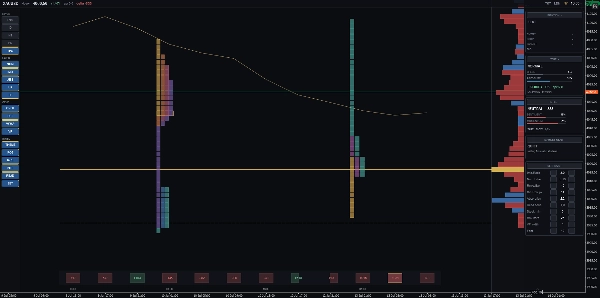
DRX OrderFlux transforme les données tick en un graphique de flux d'ordres clair, montrant où le momentum s'arrête et quels niveaux l'enchère teste à plusieurs reprises. CE QU'IL DESSINE - Empreinte Bid x Ask : Divisée en niveaux de prix avec activité d'achat et de vente côte à côte. Cinq vues : Bid x Ask, Delta, Heatmap, Profil et TPO. - Déséquilibres et murs empilés : Met en évidence les niveaux de prix où le déséquilibre de volume dépasse le ratio choisi. - Absorption et enchères inachevées : Détecte une forte activité qui ne pousse pas le prix plus loin, ainsi que les niveaux extrêmes qui se ferment de manière incomplète. - Impressions uniques : Met en évidence les niveaux de prix visités brièvement avant des rejets rapides. - Profil de volume : Affiché dans un panneau fixé au bord droit avec POC, VAH, VAL et VWAP de session. - Blocs temporels TPO : Un profil par session avec POC dédié, codé par couleur chronologiquement. - Voie Delta : Positionnée en bas sur un seul alignement pour une comparaison directe. - Lecture du marché : Signaux discrets apparaissant lors de rejets clairs ou de ruptures de volume. Les seuils s'auto-calibrent automatiquement par symbole. - Panneau de bande : Mesure la vitesse actuelle de la bande par rapport aux niveaux moyens et fournit des avertissements de liquidité. - Panneau de position : Affiche l'entrée, le stop, la cible, le PnL et le ratio Risque-Rendement avec des lignes claires sur le graphique. Les paramètres de disposition sont sauvegardés automatiquement par symbole et période. COMMENT L'UTILISER Compatible avec tous les symboles et périodes. Idéal pour l'analyse intrajournalière (M1 à H1). Fonctionne avec DRX Footprint Lower pour des volets dédiés au volume, delta et delta cumulatif. À PROPOS DES DONNÉES Les données tick cTrader incluent le temps, les cotations bid et ask, mais ne transmettent pas la taille des transactions. DRX OrderFlux mesure l'activité tick plutôt que le volume de contrats échangés, suivant la méthodologie standard du volume tick FX. Les données Depth of Market dépendent des flux du courtier. La plupart des comptes CFD fournissent des niveaux agrégés limités ; par conséquent, les avertissements de liquidité sont intégrés dans le panneau de bande plutôt que dans une échelle de carnet d'ordres.
Résumé
Key features include five distinct views: Bid x Ask footprint, Delta, Heatmap, Volume Profile, and TPO (Time Price Opportunity). The indicator highlights imbalances and stacked walls where one side dominates, absorption zones where heavy activity fails to move price, unfinished auctions, and single prints—levels touched only once. The volume profile panel shows POC (Point of Control), VAH (Value Area High), VAL (Value Area Low), and session VWAP. TPO profiles per session are color-coded to compare auction shapes across days.
Additional tools include a delta lane for comparing bars, a market read panel that signals price rejections or breaks with volume and delta confirmation, a tape panel showing tape speed and liquidity warnings, and a position panel displaying entry, stop, target, PnL, pips, and risk-reward ratio. Layouts are saved per symbol and timeframe for consistent workspace setup.
DRXFootprint uses cTrader tick data, measuring tick activity rather than traded contract volume, and includes liquidity warnings based on broker depth of market data.
Avis clients
Discussion
Questions fréquentes
















Prix
