


Description
Ce que cela fait
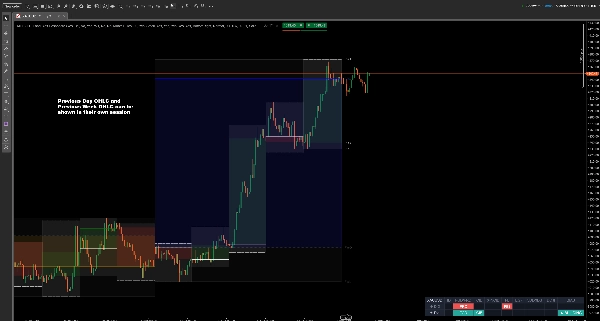
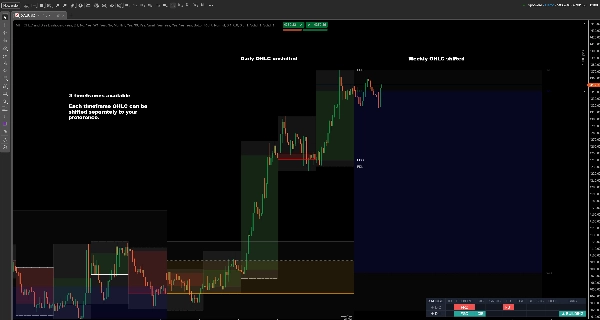
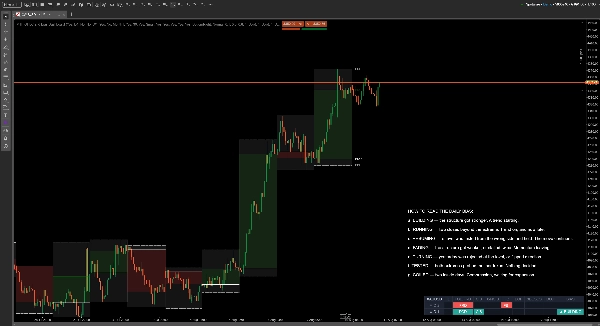
MULTI-TIMEFRAME OHLC et BIAS DASHBOARD est un indicateur d'action de prix multi-échelles pour cTrader. Il trace les niveaux OHLC du jour précédent, de la semaine précédente et du mois précédent — ouverture, haut, bas et clôture — sur votre graphique, et ajoute un tableau de bord qui lit ce que le prix a réellement fait à ces niveaux au cours des deux derniers jours complets.
Le plus haut et le plus bas du jour précédent (PDH et PDL), l'ouverture quotidienne, le plus haut et le plus bas hebdomadaires : ce sont les niveaux de support et de résistance des échelles supérieures sur lesquels la plupart des traders intraday et swing travaillent déjà. Ce qu'ils font habituellement à l'œil chaque matin, c'est les comparer — est-ce que la clôture d'hier était au-dessus de celle de la veille ? Le prix a-t-il franchi le plus haut du jour précédent pour échouer ? Le mouvement est-il en train de se construire ou est-il à bout de souffle ? Cet indicateur répond à ces questions sur le graphique, en une seule ligne.
Niveaux OHLC multi-échelles
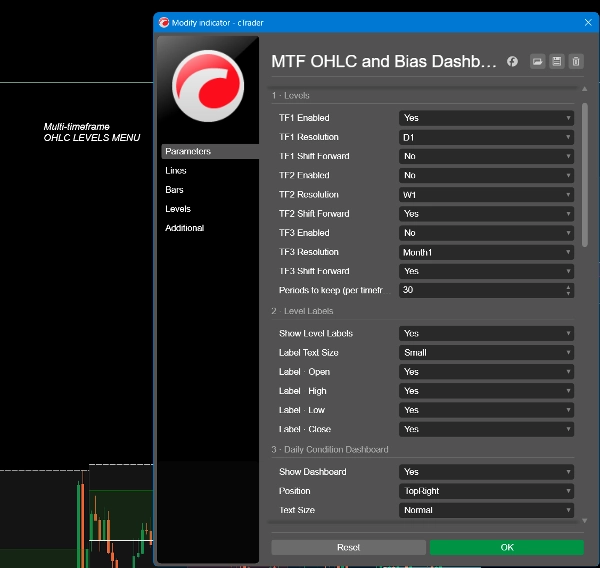
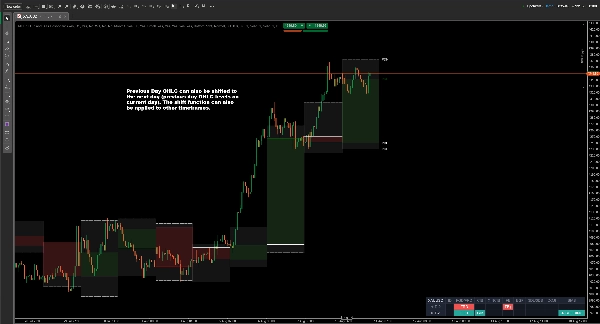
Jusqu'à trois échelles de temps simultanément — quotidienne, hebdomadaire, mensuelle, ou toute résolution que vous choisissez. Chacune trace son ouverture, son plus haut, son plus bas et sa clôture, avec un corps ombré optionnel et une bande du plus haut au plus bas. Les niveaux peuvent être décalés vers l'avant afin que la référence de la période en cours soit devant le prix plutôt que derrière, et vous pouvez conserver jusqu'à 70 périodes historiques sur le graphique.
Chaque ligne a sa propre couleur, épaisseur et style, de sorte qu'un niveau de support hebdomadaire ne soit jamais confondu avec un niveau quotidien.
Le tableau de bord de la condition quotidienne
Le tableau de bord évalue les deux dernières chandelles quotidiennes complètes — D-1 (hier) et D-2 (avant-hier) — chacune par rapport au jour qui la précédait.
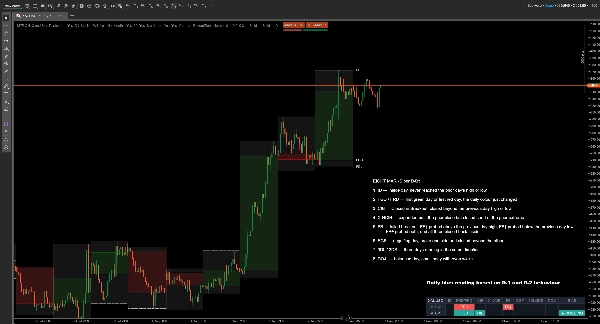
Neuf marques par jour :
- ID — journée intérieure, n'a jamais atteint le plus haut ou le plus bas du jour précédent
- FGD / FRD — premier jour vert ou premier jour rouge, la couleur quotidienne vient de changer (Vert est un jour haussier et Rouge est un jour baissier)
- CIB — clôturé en cassure, clôturé au-delà du plus haut ou du plus bas du jour précédent
- X-NCIB — étendu au-delà de la clôture précédente mais clôturé avant l'extrême précédent (Expand Not Closed In Breakout = X-NCIB)
- FB — cassure ratée : FB↑ a sondé au-dessus du plus haut du jour précédent, FB↓ a sondé en dessous du plus bas du jour précédent, FB± a sondé les deux, et les trois ont clôturé à l'intérieur
- EGF — journée engloutissante, a cassé d'un côté et clôturé au-delà de l'autre
- 3DL / 3DS — trois jours consécutifs dans la même direction (3 jours de hausse = 3DL / 3 jours de baisse = 3DS)
- DOJI — journée équilibrée, petit corps avec des mèches égales
- BIAS — la lecture, expliquée ci-dessous
Comment lire le biais quotidien
Le biais est la partie qui vous fait gagner du temps. Chaque jour se résume à un état unique, et le biais vient du mouvement entre D-2 et D-1 — pas d'hier seul. La même marque signifie des choses différentes selon ce qui l'a précédée, et c'est exactement ce qu'un tableau de bord d'un seul jour ne peut pas vous dire.
- EN CONSTRUCTION — la structure s'est renforcée. Une tendance démarre.
- EN COURS — deux clôtures au-delà de l'extrême. Tendance en cours, et maintenant tardive.
- REPRISE — un niveau a été testé du mauvais côté et a tenu. Le mouvement continue.
- FAIBLISSEMENT — la structure s'est affaiblie, ou s'est arrêtée deux fois. Le momentum s'en va.
- RENVERSEMENT — hier a été rejeté au niveau, ou a changé de direction.
- TESTÉ — les deux extrêmes sondés, aucun pris. Rien de décidé.
- COMPRIMÉ — deux journées intérieures. Compression, attente d'expansion.
Une flèche et une couleur indiquent la direction : vert vers le haut pour haussier, rouge vers le bas pour baissier, gris neutre lorsqu'il n'y a pas de direction à donner.
Les deux lignes de détail restent visibles au-dessus du biais, afin que vous puissiez toujours voir pourquoi il lit ce qu'il lit plutôt que de faire confiance à une boîte noire.
Utilisation typique
Ouvrez le graphique le matin, lisez le biais, et sachez avant le début de la session si vous cherchez une continuation, un affaiblissement ou une plage. Ensuite, tradez vos propres configurations contre les niveaux tracés — le plus haut et le plus bas du jour précédent, l'ouverture quotidienne, les extrêmes hebdomadaires.
Il convient au travail sur la plage d'ouverture, au trading de cassures ratées et aux stratégies de continuation jour après jour. Utile sur le forex, les indices, les métaux et la crypto.
Paramètres
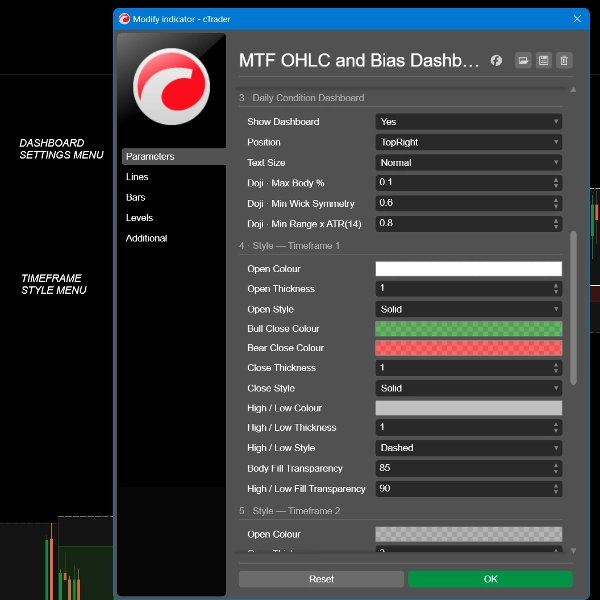
- Trois emplacements de plages de temps indépendants, chacun avec sa propre résolution, un basculement de décalage vers l'avant et des contrôles complets de couleur, d'épaisseur et de style
- Nombre de périodes historiques à conserver, jusqu'à 70
- Étiquettes de niveau activées ou désactivées, par type de ligne, avec taille de texte ajustable
- Tableau de bord activé ou désactivé, cinq positions à l'écran, quatre tailles de texte
- Sensibilité Doji : pourcentage maximal du corps, symétrie minimale des mèches, plage minimale relative à la moyenne sur 14 jours
******************************************************
Pour qui c'est
Les traders intraday et swing qui travaillent déjà à partir des niveaux du jour précédent et de la semaine précédente. Il suppose que vous savez ce qu'est un plus haut du jour précédent et pourquoi cela importe. Si ces niveaux ne font pas déjà partie de votre façon de trader, ceci ne vous apprendra pas à les utiliser.
Ce qu'il ne fait pas
Être clair à ce sujet maintenant nous fait gagner du temps à tous les deux plus tard :
- Il ne donne aucun signal d'achat ou de vente, ni aucun prix d'entrée ou de sortie
- Il ne passe aucune commande et ne peut pas accéder à votre compte — l'indicateur fonctionne sans aucun droit d'accès
- Il n'a pas d'alertes ni de notifications
- Il ne prédit rien. Chaque marque décrit des chandelles déjà clôturées
- Il ne repeint pas. Le tableau de bord lit uniquement les chandelles quotidiennes complètes, donc une lecture ne change jamais après coup
- Ce n'est pas une stratégie. Le biais décrit la structure ; il ne recommande pas un trade
********************************************************
Choses à savoir
Le tableau de bord nécessite au moins quatre chandelles quotidiennes complètes, donc un symbole nouvellement listé affichera des tirets jusqu'à ce qu'il ait suffisamment d'historique.
Les chandelles quotidiennes commencent à l'heure du serveur de votre courtier. Deux courtiers sur le même instrument peuvent couper la journée à des heures différentes, ce qui signifie que le même symbole peut légitimement être lu différemment sur deux plateformes. C'est une propriété des données, pas une faute de l'indicateur.
Au-dessus de l'échelle de temps quotidienne, le tableau de bord ne peut pas lire les données quotidiennes et affiche un avertissement TF > D. Les niveaux continuent de s'afficher.
Le trading comporte des risques. Les performances passées ne garantissent pas les résultats futurs.
Résumé
A central feature is the two-day price action bias dashboard, which analyzes the last two completed daily candles relative to their preceding days. It categorizes daily price behavior into nine distinct patterns (e.g., inside day, first green/red day, failed breakout, engulfing day) and summarizes the overall bias into states such as building, running, fading, or turning. Directional bias is indicated with colored arrows (green for bullish, red for bearish, grey for neutral), helping traders quickly assess market structure without guesswork.
Designed for intraday and swing traders familiar with previous day and week levels, the indicator does not provide trade signals, alerts, or order execution. It is suitable for forex, indices, metals, and cryptocurrencies, aiding strategies like opening-range, failed-breakout, and continuation trading by clearly marking key levels and daily price action context.
Avis clients
Discussion
Questions fréquentes
Plus de cet auteur


Vous pourriez aussi aimer

![Logo de "[Hamster-Coder] Moving Average MTF"](https://cdn.ctrader.com/image/webp/b11b98b1-194d-4b8e-b00e-d611826ad159_31226)
















Prix