

present
Inscrivez-vous et bénéficiez d'une remise de 50 $ sur votre premier achat
Trading product for HTF Candles with Sweeps Indicateur Fibonacci Engulfing, image 1
HTF Candles with Sweeps
Indicateur
Version 1.0, Aug 2026
Windows, Mac
Trading product for HTF Candles with Sweeps Indicateur Fibonacci Engulfing, image 2
Trading product for HTF Candles with Sweeps Indicateur Fibonacci Engulfing, image 3
Trading product for HTF Candles with Sweeps Indicateur Fibonacci Engulfing, image 4
Trading product for HTF Candles with Sweeps Indicateur Fibonacci Engulfing, image 5
Trading product for HTF Candles with Sweeps Indicateur Fibonacci Engulfing, image 6
Trading product for HTF Candles with Sweeps Indicateur Fibonacci Engulfing, image 7
Trading product for HTF Candles with Sweeps Indicateur Fibonacci Engulfing, image 8
Trading product for HTF Candles with Sweeps Indicateur Fibonacci Engulfing, image 9
Trading product for HTF Candles with Sweeps Indicateur Fibonacci Engulfing, image 10
Trading product for HTF Candles with Sweeps Indicateur Fibonacci Engulfing, image 11
Trading product for HTF Candles with Sweeps Indicateur Fibonacci Engulfing, image 12
Trading product for HTF Candles with Sweeps Indicateur Fibonacci Engulfing, image 13
Depuis le 08/08/2026

Description

What it does

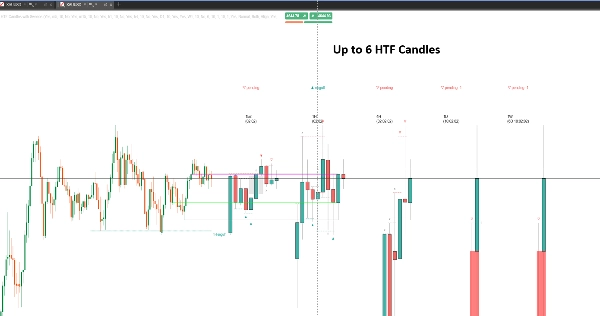
HTF Candles with Sweeps draws up to six higher timeframes as real candles beside your chart — 5m, 15m, 1H, 4H, Daily, Weekly, or any resolutions you choose — so the higher timeframe story sits next to the price you are trading rather than one chart switch away.

On top of those candles it detects liquidity sweeps: a candle that trades through a high or low behind it to take the orders resting there. Most tools stop at flagging the poke. This one follows what happens next, because a sweep that gets reclaimed and a sweep that turns into a breakout mean opposite things.


The higher-timeframe panel

Six independent slots, each with its own timeframe, candle count and colours. Every set draws with proper bodies and wicks, a live countdown to the next close, and timeframe labels above and below.

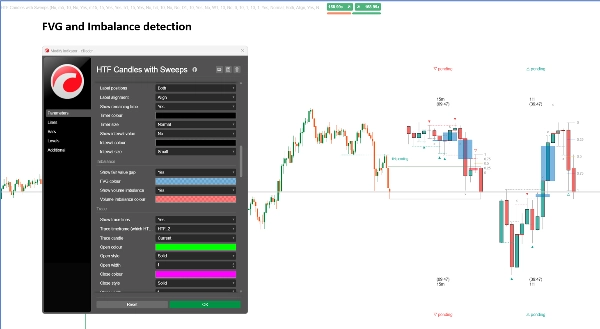
Between the drawn candles the panel also marks fair value gaps and volume imbalances — the same imbalances you would read on the higher-timeframe chart itself, without opening it.

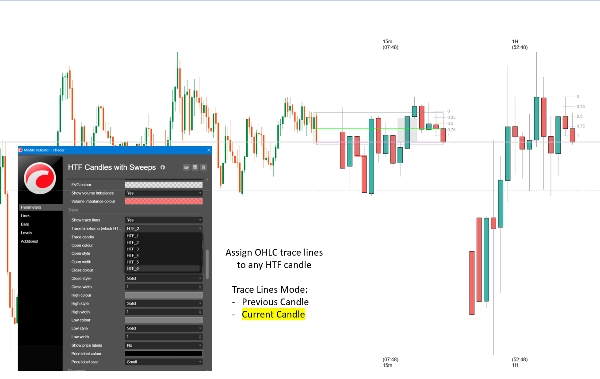
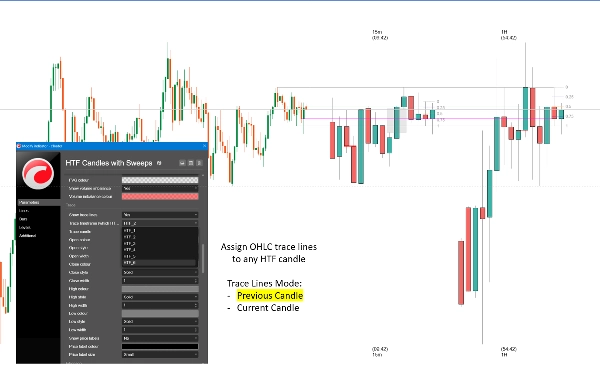
Trace lines connect a chosen timeframe's open, high, low and close back to the exact bar on your chart where each printed, so you can see where a level came from. Choose the still-forming candle or the last completed one.

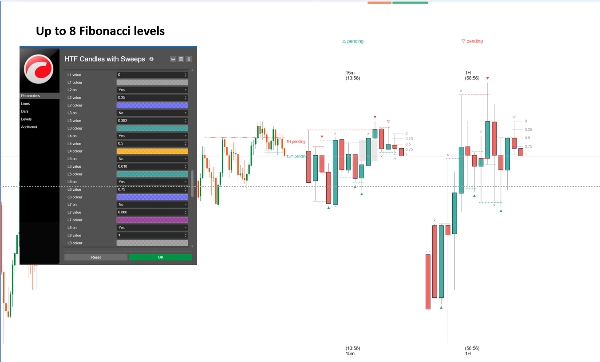
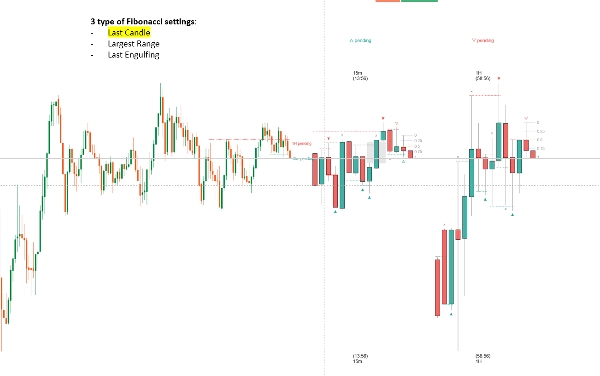
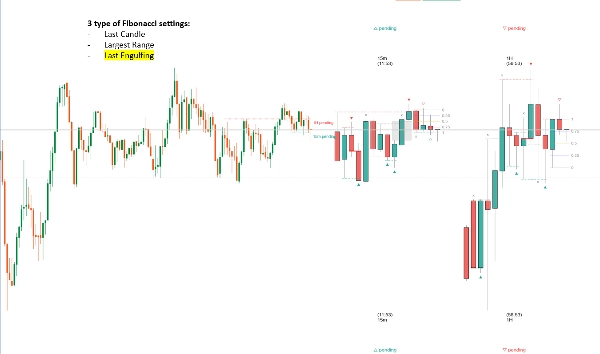
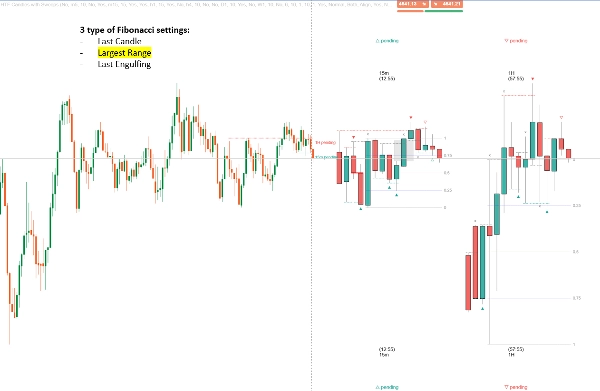
Fibonacci levels project from a higher-timeframe candle with eight configurable levels and a Smart Anchor that picks the candle for you: the last completed bar, the widest high-to-low candle in view, or the most recent engulfing candle.


Liquidity sweep detection

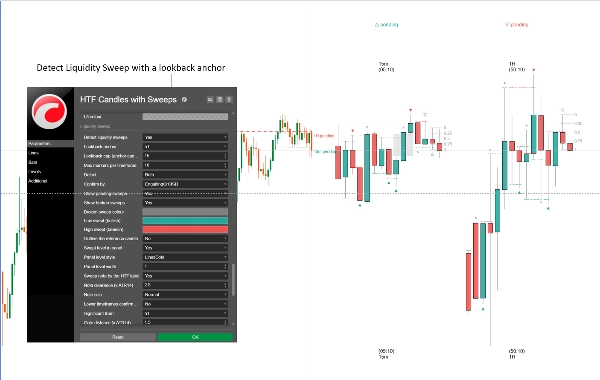
For each completed higher-timeframe candle the engine walks backwards and finds the highest high — or lowest low — that the candle actually cleared, stopping at the first candle it could not clear. That level is what the sweep took.

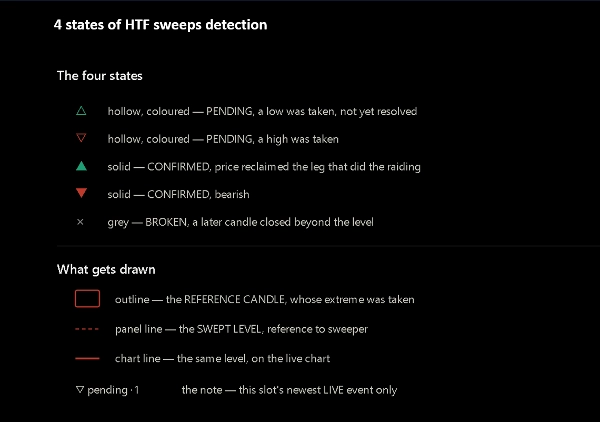
The sweep is then followed through four states:

Pending — the level was taken, nothing has resolved it yet

Confirmed by CISD — price closed back through the open of the run that produced the extreme

Confirmed by engulfing — a later candle's body swallowed the sweeping candle and closed against it

Broken — a later candle closed beyond the level, so it was a breakout, not a sweep

Every state carries its own marker, so a candle that swept something always shows it, and the marker tells you how it ended. Nothing repaints: only completed candles are judged, and each state change is decided on a close.


Cross-timeframe confluence

One lookback window is expressed in candles of an anchor timeframe and converted into every slot's own candle count, so a 15m sweep and an hourly sweep are measured across the same span of market. When several timeframes agree, they are genuinely describing the same event.

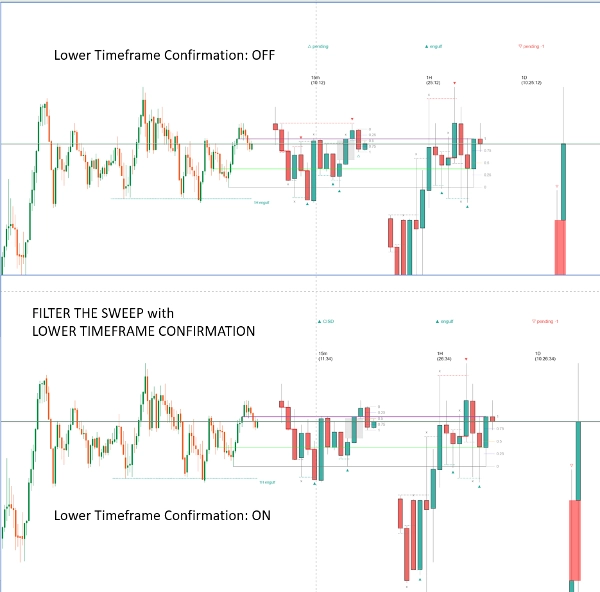
An optional gate takes this further: timeframes below a split you choose will only report a sweep when a timeframe above them already has one live, in the same direction, at a comparable price. Lower timeframes stop reporting range noise and start confirming the bigger move.

Swept levels on your chart

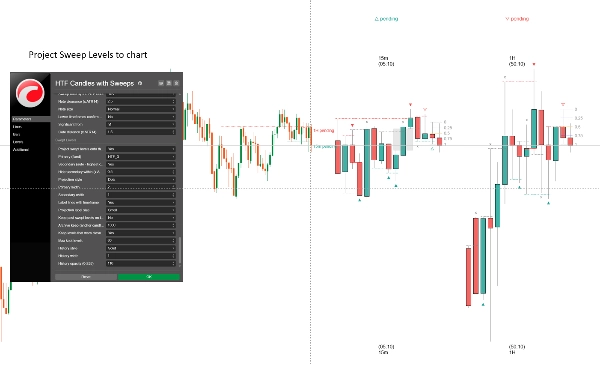
The panel shows the candles; the chart shows the price. A swept level draws as a horizontal line running from where the reference candle actually formed, forward to now — labelled with its timeframe and current state. A primary line comes from a timeframe you fix; a secondary line fills automatically with the highest other timeframe currently swept.

An optional archive keeps past swept levels on the chart after their candle has scrolled out of the panel, so you can look back over how the detection behaved across the session.


Typical use

Trade from a 5m or 15m chart while the hourly and 4-hour candles sit beside it. When a higher timeframe sweeps a level and confirms, you have a direction and a price to work from. When the lower timeframe agrees, you have confluence. When a level breaks instead, the marker tells you that too, and you stop waiting for a reversal that is not coming.

It suits liquidity-sweep and smart-money style trading, failed-breakout work, and any approach built around previous highs and lows. Useful across forex, indices, metals and crypto.

Settings

— Six timeframe slots, each with resolution, candle count, fibonacci toggle and full styling

— Panel layout: padding from price, candle width, spacing between candles and between timeframes

— Labels: timeframe name top and bottom, countdown timer, interval values, sizes and colours

— Imbalance: fair value gaps and volume imbalances, colours adjustable

— Trace lines: which slot, current or previous candle, per-line colour, style, width and price labels

— Fibonacci: eight levels with individual values, colours and toggles, plus three Smart Anchor modes

— Sweep detection: lookback anchor and cap, direction, confirmation route, marker limit per timeframe

— Marker appearance for pending, confirmed and broken states

— Confluence gate: split timeframe and distance tolerance

— Chart projection: primary slot, automatic secondary, styles and labels

— Archive: retention in anchor candles, maximum kept, styling


Who it is for

Intraday and swing traders who already work from higher-timeframe highs and lows and want them visible without switching charts. It assumes you know what a liquidity sweep is and why a reclaim matters. If sweeps are not already part of how you read a chart, this will not teach you to trade them.

What it does not do

Being clear about this now saves us both time later:

— It gives no buy or sell signals, and no entry, stop or target prices

— It places no orders and cannot touch your account — the indicator runs with no access rights at all

— It has no alerts or notifications

— It predicts nothing. Every marker describes candles that have already closed

— It does not repaint. Only completed candles are judged, so a marker never changes after the fact

— It is not a strategy. A confirmed sweep describes what price did, not what you should do about it

Things worth knowing

Detection reads the candles each slot actually draws, so a sweep always has a candle on screen to mark.

Raising a slot's candle count widens how far back it can look.

Higher-timeframe candles start at your broker's server time. Two brokers on the same instrument can cut the hour or the day at different points, which means the same symbol can legitimately read differently on two platforms. That is a property of the data, not a fault in the indicator.

A sweep on the most recently closed candle can only be pending — confirmation needs a later candle to close. On the daily slot that means waiting a day.

Trading involves risk. Past performance does not guarantee future results.

Résumé

Profil de l'indicateur
Catégorie de l'indicateur
Structure du marché (SMC)
Type de résultat
Signaux
Exigences en matière de données
Barres seulement
Données de tick
Signaux pris en charge
Cassure
Inversion
Atteinte du niveau

Avis clients

0.0
Avis : 0
Avis clients
Il n'y a pas encore d'avis sur ce produit. Vous l'avez déjà essayé ? Soyez le premier à en parler aux autres !

Discussion

Questions fréquentes

Fibonacci
Engulfing
Fair Value Gap
Liquidity Sweep
Imbalance
Liquidity Grab
Les produits disponibles sur cTrader Store, notamment les bots de trading, les indicateurs et les plug-ins, sont fournis par des développeurs tiers et mis à disposition à titre informatif et à des fins d'accès technique uniquement. cTrader Store n'est pas un courtier et ne fournit aucun conseil en investissement, aucune recommandation personnelle ni aucune garantie quant aux performances futures.

Plus de cet auteur

Indicateur
Doji
Engulfing
+3
Multi Timeframe OHLC levels (daily, weekly, and monthly), with a two-day price action bias dashboard

Vous pourriez aussi aimer

Indicateur
Volume
Key Levels
+4
Margin Zones its CME-based support/resistance levels from price extremes, helps traders spot entries and exits NKZ zones
Indicateur
ATR
Prop
+14
Optimize exits with Chandelier Exit! Visualize stop-loss points dynamically for improved trading precision and safety.
Indicateur
Prop
Forex
+4
Universal multi time frame 'Moving Average' indicator with extended features
Indicateur
Prop
Forex
+5
Traders Panel: Scan 15 pairs across 5 timeframes. Live heatmap, strength rankings and best setups in one panel.
Indicateur
ATR
MACD
+15
BrickAlgo TrendPulse is an advanced technical analysis tool that combines multiple indicators with filterin mechanisms.
Indicateur
Customize your Moving Average! Choose any timeframe and price source for precision and flexibility in your analysis.
Indicateur
Prop
Forex
+13
Volume Meter
Indicateur
Prop
Forex
+11
⚡Nebula Range Filter is a professional trend filter indicator for cTrader⚡
Indicateur
BOS
CHOCH
+5
A professional-grade cTrader indicator for traders following the Inner Circle Trader (ICT) methodology.
Indicateur
Prop
Forex
+13
Color Volume Bars – Visualize Market Strength Instantly
Indicateur
Forex
EURUSD
+3
Forex Strength Meter for cTrader: 4 custom currencies, cross alerts, visual arrows. Trade smarter!
Indicateur
Volume
Channel
+5
Spots volatility squeezes before they fire — the compression phase everyone else misses.
Indicateur
BOS
CHOCH
+5
BOS/CHoCH signals confirmed by liquidity sweep + FVG confluence, with a live conviction score.
Logo de "Boris Indicator"
Les mieux notés
4.6
(5)
$19
/
$28
Indicateur
AI
Grid
+17
BORIS Easy Trend: Relax & scalp with 6-TF alignment. Clear BUY/SELL signals & movable UI/HUD make trading effortless.
Indicateur
Forex
GBPUSD
+5
Visual warning zones for high-impact news so you can manage risk before volatility hits.
Indicateur
SMC
Prop
+4
📈 Trading Sessions Indicator — London, New York & Tokyo Visualize Key Market Sessions + High/Low Levels with Precision
Indicateur
Forex
Crypto
+4
Spot powerful 3-candle reversal patterns like Morning/Evening Star and Soldiers/Crows at key swing highs and lows
Indicateur
Customizable window inside your platform, access to any website Calendar

Prix

Depuis le 08/08/2026



















