
Description
## 📊 Qu'est-ce que Squeeze Momentum Pro ?
Squeeze Momentum Pro est un indicateur professionnel de volatilité et de momentum basé sur la célèbre stratégie de squeeze popularisée par John Carter. Il identifie les périodes de compression du marché (squeeze) et anticipe les mouvements explosifs avant qu'ils ne se produisent.
L'indicateur combine deux puissants outils de mesure de la volatilité :
- **Bandes de Bollinger** (période 20, écart-type 2.0)
- **Canaux de Keltner** (période 20, multiple ATR 1.5)
Lorsque les bandes de Bollinger se contractent à l'intérieur des canaux de Keltner, un "squeeze" est détecté, signalant que le marché accumule de l'énergie pour un mouvement explosif potentiel.
## 🎯 Fonctionnalités clés
### 1. Système de détection de squeeze
- **Points noirs** = Squeeze actif (le marché se comprime, préparez-vous à une cassure)
- **Points bleus** = Squeeze libéré (la cassure est en cours, observez la direction du momentum)
- **Points gris** = Pas de squeeze (conditions normales du marché)
### 2. Histogramme de momentum
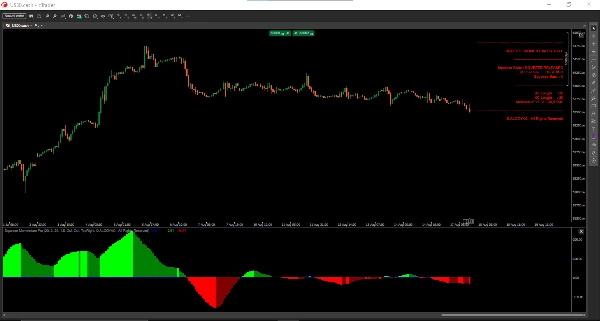
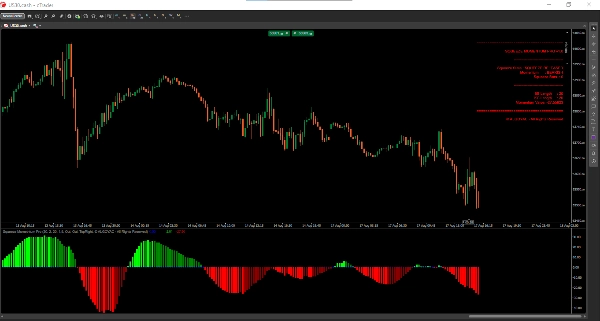
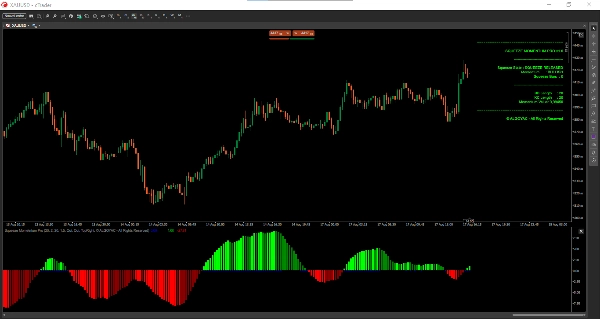
L'histogramme affiche le momentum du marché avec 4 couleurs distinctes :
- **Vert citron** = Momentum haussier fort (en augmentation)
- **Vert foncé** = Momentum haussier faible (en diminution)
- **Rouge** = Momentum baissier fort (en diminution)
- **Bordeaux** = Momentum baissier faible (en augmentation)
### 3. Tableau de bord en temps réel
Tableau de bord intégré affichant :
- État actuel du squeeze
- Direction du momentum
- Nombre de barres en squeeze
- Paramètres actifs
## 📈 Comment interpréter les signaux
### Cassure Squeeze + Momentum
Lorsque l'histogramme passe du rouge au vert citron en sortant d'un squeeze (points noirs), cela représente un signal haussier fort.
### Durée du squeeze
Les périodes de squeeze plus longues conduisent souvent à des cassures plus puissantes. Le tableau de bord affiche le nombre de barres en squeeze pour aider à évaluer la volatilité potentielle.
### Transitions de couleur du momentum
- **Rouge → Bordeaux** : Pression vendeuse en baisse, retournement potentiel
- **Citron → Vert** : Pression acheteuse en baisse, retournement potentiel
- **Bordeaux → Citron** : Fort retournement haussier
- **Vert → Rouge** : Fort retournement baissier
## ⚙️ Paramètres et réglages
### Groupe Bandes de Bollinger
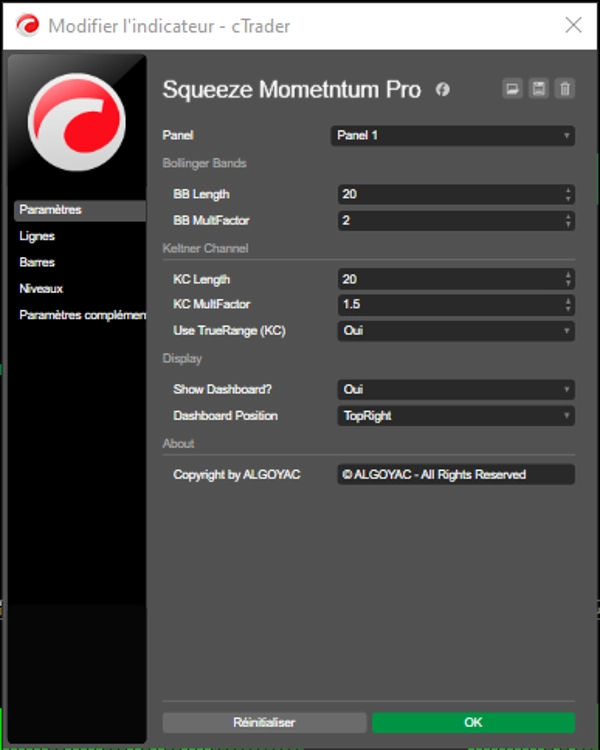
- **BB Length** (par défaut : 20) : Période pour le calcul des bandes de Bollinger
- **BB MultFactor** (par défaut : 2.0) : Multiplicateur d'écart-type
### Groupe Canal de Keltner
- **KC Length** (par défaut : 20) : Période pour le calcul du canal de Keltner
- **KC MultFactor** (par défaut : 1.5) : Multiplicateur ATR
- **Use TrueRange** (par défaut : true) : Basculer entre True Range et plage High-Low
### Groupe Affichage
- **Show Dashboard** (par défaut : true) : Afficher le panneau d'information en temps réel
- **Dashboard Position** : Choisir parmi 4 positions
## 💼 Cas d'utilisation typiques
### Scalping
- Utiliser sur les périodes M1-M5
- Entrer lors de la libération du squeeze avec confirmation du momentum
- Sortir lorsque la couleur du momentum change
### Trading journalier
- Utiliser sur les périodes M15-H1
- Combiner avec les niveaux de support/résistance
- Entrer au premier retracement après la libération du squeeze
### Swing Trading
- Utiliser sur les périodes H4-D1
- Rechercher des squeezes sur plusieurs barres
- Entrer lors de la transition de couleur du momentum du rouge au citron (ou inversement)
## 👥 Pour qui est cet indicateur ?
### Convient à :
- **Traders de cassure** : Identifier le momentum avant les cassures
- **Traders de volatilité** : Évaluer les phases de compression du marché
- **Traders de momentum** : Suivre la force de la tendance et les retournements
- **Débutants à avancés** : Interface intuitive avec des fonctionnalités professionnelles
### Niveau d'expérience :
- **Débutants** : Commencez avec les réglages par défaut, utilisez le tableau de bord pour vous guider
- **Intermédiaires** : Ajustez les paramètres pour des marchés spécifiques
- **Avancés** : Combinez avec l'action des prix et plusieurs périodes
## ⚠️ Notes importantes et limitations
1. **Fausse cassures** : Tous les squeezes ne conduisent pas à des cassures fortes. Utilisez toujours une confirmation supplémentaire.
2. **Conditions de marché** : Fonctionne mieux dans les marchés en tendance. Peut donner de faux signaux dans les marchés en range.
3. **Sensibilité des paramètres** : Les réglages par défaut fonctionnent bien pour la plupart des marchés mais peuvent nécessiter un ajustement pour certains instruments.
4. **Pas un système autonome** : À utiliser de préférence avec d'autres outils d'analyse technique pour confirmation.
5. **Performance passée** : Les signaux historiques ne garantissent pas les résultats futurs.
## 🔧 Réglages recommandés par marché
| Market | BB Length | KC Length | Timeframe |
|--------|-----------|-----------|-----------|
| Forex | 20 | 20 | H1-H4 |
| Stocks | 20 | 20 | D1 |
| Crypto | 30 | 30 | H1-H4 |
| Indices| 25 | 25 | M15-H1 |
## 🚀 Pour commencer
1. Ajoutez l'indicateur à votre graphique
2. Gardez les réglages par défaut initialement
3. Surveillez les points noirs (formation du squeeze)
4. Attendez la libération du squeeze (points bleus)
5. Confirmez avec la couleur du momentum (citron pour achat, rouge pour vente)
6. Utilisez le tableau de bord pour une référence rapide
Résumé
Key features include a squeeze detection system with color-coded dots (black for active squeeze, blue for squeeze release, gray for no squeeze), and a momentum histogram displaying four colors to represent bullish and bearish momentum strength and direction. A real-time dashboard provides current squeeze status, momentum direction, squeeze duration, and active parameters.
The indicator supports multiple trading styles and timeframes: scalping (M1-M5), day trading (M15-H1), and swing trading (H4-D1). It is suitable for breakout, volatility, and momentum traders across markets such as Forex, stocks, crypto, and indices, with recommended parameter settings for each.
Users interpret signals by monitoring squeeze states and momentum color transitions to identify potential entries and exits. Adjustable settings allow customization of Bollinger Bands and Keltner Channel parameters, as well as dashboard display options. The indicator is designed for use alongside other technical analysis tools to confirm signals.
Avis clients
5 | 50 % | |
4 | 50 % | |
3 | 0 % | |
2 | 0 % | |
1 | 0 % |