Описание
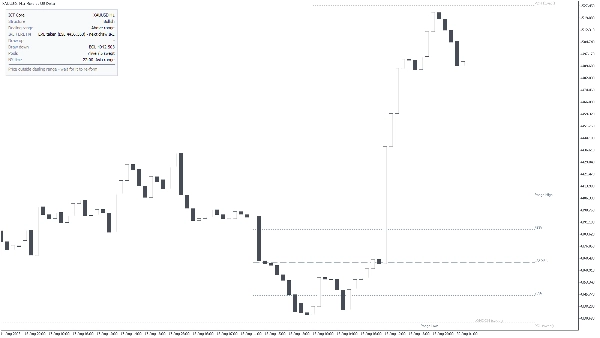
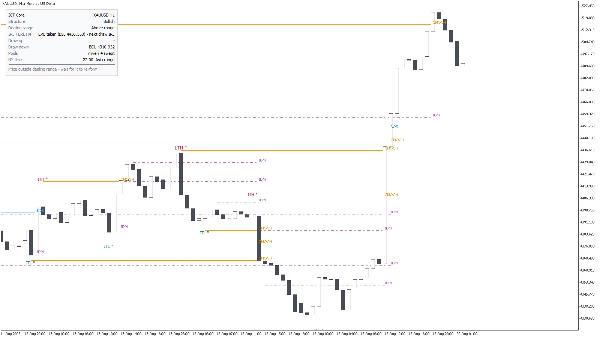
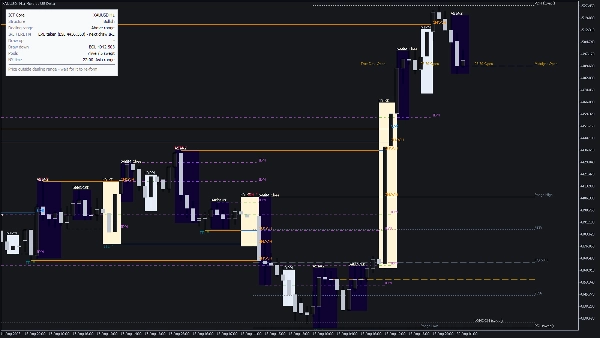
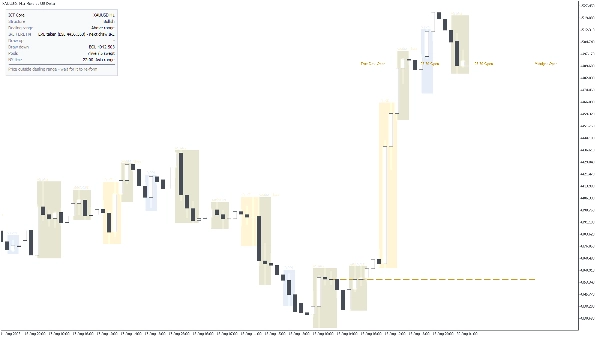
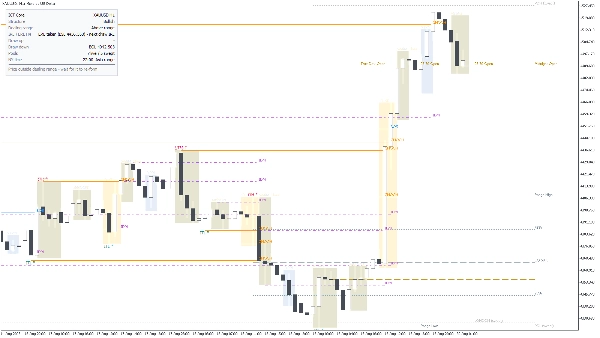
ICT Core превращает необработанный график цен в структурированный отчет по концепциям Smart Money (ICT): структура рынка, пулы ликвидности, диапазон сделок, состояние IRL / ERL, сессии Нью-Йорка и killzones, а также панель, которая указывает текущий уклон и условный план простым английским языком. Он использует только закрытые, подтвержденные ценовые действия — как только уровень или метка напечатаны, они остаются на месте.
ЧТО АНАЛИЗИРУЕТСЯ
ICT Core считывает данные баров (открытие / максимум / минимум / закрытие) с символа графика, а также один более высокий таймфрейм по вашему выбору (по умолчанию H4) для чтения IRL / ERL. ATR используется для масштабирования размера колебаний, расстояния между метками и допуска равных максимумов / минимумов, чтобы одни и те же настройки работали последовательно на XAUUSD, индексах и FX. Время сессий и killzone рассчитывается по времени Нью-Йорка с автоматической обработкой перехода на летнее время, а не по фиксированным часам брокера.
ЧТО ОН РИСУЕТ И КАК ЭТО ЧИТАТЬ
- Структура рынка. Колебания классифицируются как краткосрочные, среднесрочные и долгосрочные. Прорывы обозначаются как BOS (продолжение) или CHOCH (изменение характера); прорыв, сделанный только тенью, отмечается отдельно как sweep, чтобы вы могли отличить реальное смещение от рейда. Максимумы и минимумы, взятые импульсной ногой, отмечены как сильные / слабые.
- Индукция (IDM). Отмечается незначительный максимум или минимум, который цена, вероятно, пройдет перед реальным движением, чтобы вы могли увидеть ловушку до того, как она сработает.
- Пулы ликвидности. Максимумы и минимумы предыдущего дня, предыдущей недели, предыдущего месяца, сессии, а также равные максимумы / минимумы отображаются как уровни покупок (BSL) и продаж (SSL). После того как пул ликвидности был выметен, он затемняется, а не удаляется, чтобы история уже взятых уровней оставалась читаемой.
- Диапазон сделок. Активный диапазон между последним действительным максимумом и минимумом с опциональными квадрантами 25% / 75% для ссылки на премию / скидку.
- IRL / ERL. Панель указывает, была ли взята внешняя ликвидность и следующий уровень внутренний, или наоборот, считая с выбранного вами более высокого таймфрейма.
- Сессии и время. Боксы Азии, Лондона, NY AM и NY PM; killzones Лондона, Нью-Йорка и закрытия Лондона; окна silver bullet; опциональные 20-минутные макросы; и линии открытия сессии.
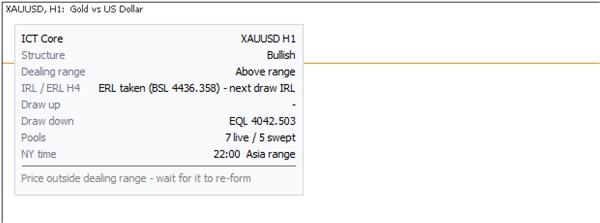
- Информационная панель. Символ и таймфрейм, уклон структуры, положение цены в диапазоне сделок, состояние IRL / ERL, ближайшие уровни выше и ниже с их ценами, сколько пулов активны и сколько выметены, время Нью-Йорка и активная сессия — плюс строка условного плана, например «Цена вне диапазона сделок — ждите его восстановления».
- Оповещения. Всплывающее окно, звук или email при выметании пула, при BOS / CHOCH и при открытии killzone.
КЛЮЧЕВЫЕ НАСТРОЙКИ
- Общие: тема графика (авто / светлая / темная), количество баров для анализа (по умолчанию 1500), размер шрифта меток и расстояние между метками (в ATR).
- Структура рынка: сила колебаний в барах с каждой стороны (по умолчанию 2), какие уровни колебаний показывать, BOS / CHOCH включены или выключены, прорывы только тенью включены или выключены, индукция включена или выключена, и размер импульса в ATR, который квалифицирует максимум или минимум как сильный (по умолчанию 1.0).
- Пулы ликвидности: какие пулы рисовать, допуск равных максимумов / минимумов в ATR (по умолчанию 0.15), сколько дней до истечения пула (по умолчанию 20), и остаются ли видимыми выметенные пулы.
- Диапазон сделок: диапазон включен или выключен, квадранты 25% / 75% включены или выключены.
- IRL / ERL: исходный таймфрейм (по умолчанию H4) и сколько его баров сканировать (по умолчанию 300).
- Сессии: боксы сессий, killzones, silver bullet, макросы, цены открытия, сколько дней назад рисовать (по умолчанию 5), и непрозрачность заливки боксов.
- Панель: угол, смещение X / Y, размер шрифта, показывать ли строку плана, сколько баров sweep считается недавним (по умолчанию 12), и требует ли план активного killzone.
- Оповещения и полный набор цветов для каждого элемента на графике.
ТИПИЧНОЕ ИСПОЛЬЗОВАНИЕ
1. Добавьте ICT Core на график M5 - H1 XAUUSD, индекса или основной валютной пары.
2. Читайте панель сверху вниз: уклон, положение в диапазоне сделок, IRL / ERL и ближайшие уровни выше и ниже.
3. Ждите, пока пул ликвидности не будет выметен внутри killzone, затем ищите CHOCH против sweep на вашем таймфрейме входа.
4. Используйте противоположный уровень, показанный на панели, как цель, а выметенный экстремум — как уровень отмены.
5. Включите оповещения о sweep и BOS / CHOCH, если не хотите наблюдать за графиком всю сессию.
ДЛЯ КОГО ОН ПРЕДНАЗНАЧЕН
Трейдеры, которые уже работают с ICT / Smart Money Concepts и хотят видеть слои структуры, ликвидности и времени на одном графике вместо того, чтобы рисовать их вручную каждый день. Он предназначен для внутридневных и краткосрочных дискретных трейдеров. Это не инструмент для начинающих с стрелками покупки / продажи — вам нужно знать, что означают BOS, CHOCH, IDM, IRL и ERL, чтобы использовать его.
ВАЖНЫЕ ОГРАНИЧЕНИЯ И ПРИМЕЧАНИЯ ПО ИСПОЛЬЗОВАНИЮ
- ICT Core — это инструмент анализа и визуализации. Он не размещает ордера, не дает сигналов на покупку / продажу, а строка плана — это условное напоминание, а не рекомендация.
- Все выводится из подтвержденных колебаний, поэтому точка структуры появляется только после закрытия необходимого количества баров с каждой стороны (по умолчанию 2). После этого ничего не перерисовывается.
- Время сессий и killzone соответствует времени Нью-Йорка с учетом DST. Ваш график отображается во времени сервера брокера, поэтому боксы не будут совпадать с фиксированным смещением UTC — это сделано намеренно.
- Чтение IRL / ERL на более высоком таймфрейме требует достаточной истории на этом таймфрейме; на символах с короткой историей оно отображается как недоступное.
- Анализ ограничен окном «баров для анализа» (по умолчанию 1500). Увеличьте его для большей истории, но это замедлит первое построение.
- Работает на cTrader Desktop для Windows и Mac. Пользовательские индикаторы недоступны на мобильных устройствах и в веб-версии.
- Торговля связана с риском. Прошлое поведение любого паттерна не гарантирует будущих результатов. Всегда используйте собственное управление рисками.
Сводка
ICT Core highlights liquidity pools from previous days, weeks, months, and sessions, showing buy-side and sell-side levels, and dims swept pools to maintain historical context. It also delineates session times and killzones based on New York time with automatic daylight saving adjustments. An info panel provides a summary of current bias, price position within the dealing range, IRL/ERL status, nearest levels, live versus swept pools, and a conditional trading plan in plain English.
Users can customize settings including chart theme, swing parameters, liquidity pool visibility, session displays, and alert notifications for pool sweeps, BOS/CHOCH events, and killzone openings. ICT Core is intended for traders familiar with ICT/SMC concepts seeking an integrated, structured view of market dynamics for intraday and short-swing discretionary trading.
![Логотип продукта "Gaussian Channel [Iridio Capital]"](https://cdn.ctrader.com/image/webp/2c4f9ca9-4e9b-476d-b5a6-787c8095032b_61546)