
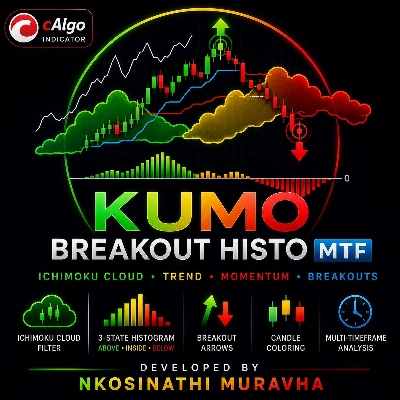
Ichimocku Histogram and Candles - Muravha
Indicateur
Version 1.0, Aug 2026
Windows, Mac
4.0
Avis : 1

4.15M
Volume tradé
39.99K
Pips gagnés
1
Ventes
Description
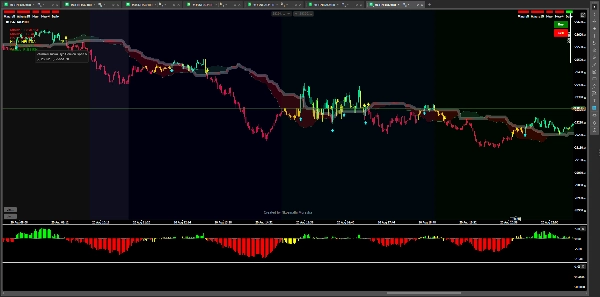
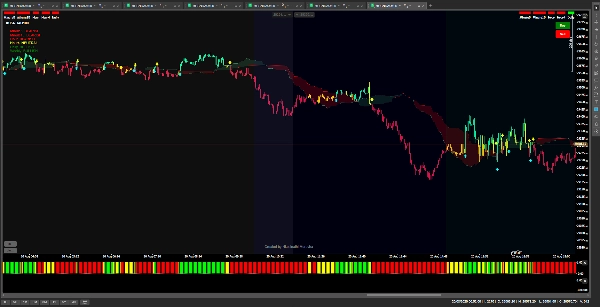
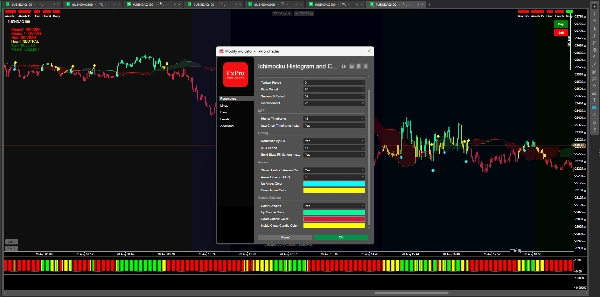
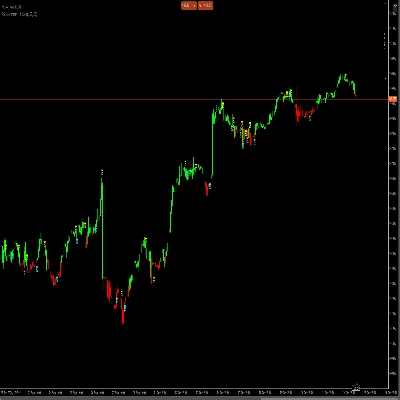
D'après le nom de l'indicateur « Ichimocku Histogram and Candles », son objectif est essentiellement de combiner l'analyse de tendance de style Ichimoku avec la visualisation par histogramme/bougies :
- Direction de la tendance : Aide à identifier si le marché est haussier ou baissier.
- Momentum : L'histogramme montre si le momentum haussier ou baissier se renforce ou s'affaiblit.
- Signaux des bougies : Les changements de couleur/d'apparence peuvent faciliter la détection des potentiels changements de momentum.
- Opportunités de trading : Les traders peuvent rechercher des changements de momentum, la continuation de la tendance et des retournements potentiels, idéalement confirmés par l'action des prix et la structure des unités de temps supérieures.
- Filtrage des trades : Plutôt que de prendre chaque signal, l'indicateur peut aider les traders à se concentrer sur les configurations où la tendance + le momentum sont en accord.
En termes simples : il est conçu pour rendre la tendance et le momentum du marché plus faciles à lire visuellement, aidant les traders à identifier les zones potentielles d'entrée et de sortie.
Résumé
Résumé IA
Ichimocku Histogram and Candles - Muravha is a trading indicator that integrates Ichimoku-style trend analysis with histogram and candle visualizations. It provides a visual representation of market trend direction, indicating whether the market is bullish or bearish. The histogram component displays momentum strength, showing whether bullish or bearish momentum is increasing or decreasing. Candle color and appearance changes highlight potential momentum shifts, making it easier to identify trade signals. The indicator helps traders spot potential buy and sell opportunities by signaling momentum changes, trend continuation, and possible reversals. It also assists in filtering trades by focusing on setups where trend and momentum align, supporting more informed decision-making. This tool is designed to simplify reading market trends and momentum visually, aiding traders in identifying potential entry and exit points. It supports analysis based on price action and higher-timeframe structure confirmation. The indicator outputs include filters, signals, and visualizations, and it supports signal types such as breakouts, trend strength, volatility regimes, level breaks, and reversals. It requires bar and volume data for operation.
Profil de l'indicateur
Catégorie de l'indicateur
Dynamique
Type de résultat
Filtre
Signaux
Visualisation
Exigences en matière de données
Barres seulement
Volume
Signaux pris en charge
Cassure
Puissance de la tendance
Volatilité
Dépassement de niveau
Inversion
Discussion
Avis clients
4.0
Avis : 1
5 | 0 % | |
4 | 100 % | |
3 | 0 % | |
2 | 0 % | |
1 | 0 % |
Avis clients
October 12, 2026
Histogram and candle colours offer a simpler visual reading of Ichimoku direction without the full cloud. The description does not establish concrete settings or measured accuracy, so the supported scope remains a visual trend aid rather than a proven entry edge.
Questions fréquentes
Ichimoku
Les produits disponibles sur cTrader Store, notamment les bots de trading, les indicateurs et les plug-ins, sont fournis par des développeurs tiers et mis à disposition à titre informatif et à des fins d'accès technique uniquement. cTrader Store n'est pas un courtier et ne fournit aucun conseil en investissement, aucune recommandation personnelle ni aucune garantie quant aux performances futures.
Plus de cet auteur
Vous pourriez aussi aimer





Prix
4.15M
Volume tradé
39.99K
Pips gagnés
1
Ventes