Описание
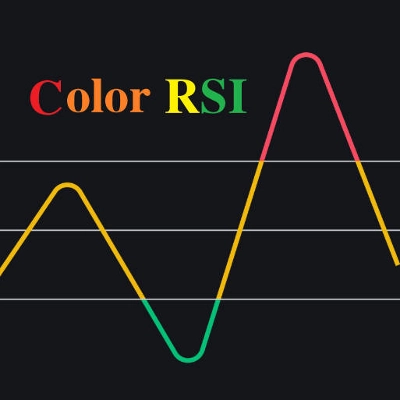
Это супер индикатор, который интегрирует индикатор RSI с системой двойных скользящих средних. Интенсивность RSI представлена четырьмя цветами: красный (>70) > оранжевый (>50) > жёлтый (>30) > зелёный. Двойные скользящие средние используют EMA с параметрами по умолчанию 48/144, которые можно настроить в соответствии с вашими потребностями.
Как использовать:
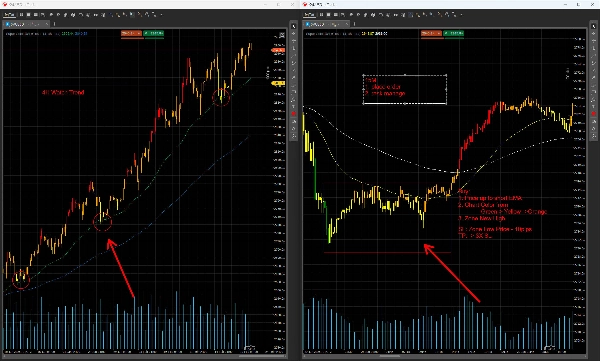
При использовании в сочетании с несколькими таймфреймами (например, 4H→15M; 1H→5M, здесь показано на примере 4H→15M):
- Определение тренда с помощью двойных EMA (таймфрейм 4H):
-
- Восходящий тренд: 48EMA выше 144EMA.
- Нисходящий тренд: 48EMA ниже 144EMA.
- Флэт (консолидация): Две EMA переплетены.
- Точки входа/выхода на таймфрейме 15M:
-
- Сигнал на покупку (восходящий тренд):
-
- Цена откатывается к 48EMA на графике 4H.
- Переключитесь на 15M: вход при пробое выше диапазона консолидации на 15M.
- Стоп-лосс: Установите на недавнем максимуме +10 пунктов .
- Сигнал на продажу (нисходящий тренд):
-
- Цена откатывается к 48EMA на графике 4H.
- Переключитесь на 15M: вход при пробое ниже диапазона консолидации на 15M.
- Стоп-лосс: Установите на недавнем минимуме –10 пунктов .
- Сигналы дивергенции цены:
-
- Медвежья дивергенция (максимум):
-
- Цена формирует новый максимум (на откате), но цвет RSI меняется с красного (RSI >70) на оранжевый (RSI >50) .
- Бычья дивергенция (минимум):
-
- Цена формирует новый минимум (на откате), но цвет RSI меняется с зелёного (RSI ≤30) на жёлтый (RSI ≤50) .
Предупреждение о рисках:
Нет индикатора, подходящего для всех рыночных условий. Тщательно протестируйте эту стратегию в демо-среде перед применением в реальной торговле. Неправильное использование может привести к значительным потерям.
Сводка
Профиль индикатора
Отзывы покупателей
0.0
Отзывы: 0
Отзывы покупателей
У этого продукта еще нет отзывов. Уже попробовали его? Поделитесь впечатлениями!
Обсуждение
Частые вопросы
Prop
Forex
Indices
Commodities
RSI
Crypto
Stocks
Продукты, доступные в cTrader Store, включая торговых ботов, индикаторы и плагины, предоставляются сторонними разработчиками и доступны исключительно в информационных и технических целях. cTrader Store не является брокером и не предоставляет инвестиционные консультации, персональные рекомендации или какие-либо гарантии будущей доходности.


Цена
С 30/09/2024
44
Продажи