
PDHL
Indicateur
1.83K téléchargements
Version 1.0, Sep 2024
Windows, Mac
2.5
Avis : 2
Description
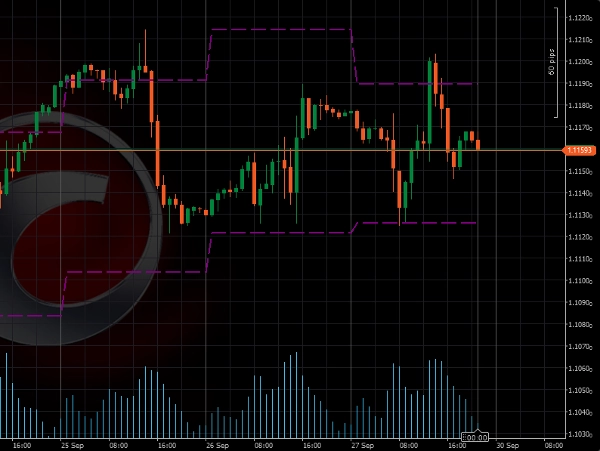
Présentation de l'indicateur de trading High-Low
Cet indicateur est conçu pour tracer automatiquement les niveaux de prix les plus hauts et les plus bas de la veille sur votre graphique. Cet outil vous aide à identifier rapidement les niveaux clés pour des cassures potentielles et des retournements.
Avantages clés :
- Idéal pour le trading de cassure : Cet indicateur met en évidence des niveaux de prix critiques de la veille, souvent utilisés comme points de référence pour les stratégies de cassure. Trader les cassures au-dessus ou en dessous de ces niveaux peut offrir des configurations à fort potentiel.
- Simple mais efficace : L'indicateur de trading High-Low se concentre sur l'un des aspects les plus importants de l'action des prix – le plus haut et le plus bas de la veille. En intégrant ces niveaux dans votre stratégie, vous obtenez une meilleure compréhension de la structure du marché et des points de retournement potentiels.
Attention :
- À utiliser de préférence sur des unités de temps inférieures à 1 jour
Paramètres :
- Inclure le dimanche : par défaut = non
Résumé
Résumé IA
The PDHL (Previous Day High & Low) indicator automatically plots the prior day's highest and lowest price levels on trading charts. It is designed to assist traders in identifying key price levels that may signal potential breakouts or reversals. By highlighting these critical levels, the indicator supports breakout trading strategies, providing reference points for entering trades when price moves above or below the previous day's range. The tool emphasizes simplicity and effectiveness by focusing on essential price action elements, helping traders better understand market structure and potential turning points. It is best used on intraday timeframes shorter than one day. A configurable setting allows users to include or exclude Sunday in the calculation, with the default setting excluding it.
Profil de l'indicateur
Avis clients
2.5
Avis : 2
5 | 0 % | |
4 | 0 % | |
3 | 50 % | |
2 | 50 % | |
1 | 0 % |
Avis clients
October 9, 2025
What Timezone is it in at default? It seems to fail to get the accurate Highs and lOws for different istruments. You could add that as a customisable input. Please add closing price too
July 9, 2025
Pros: Simple and clear display of previous day's high/low levels. Stable performance. Easy to use and customize. Cons: No breakout alerts. No visual zone fill option. Lacks additional filters or Fibo levels.
Discussion
Questions fréquentes
Breakout
Les produits disponibles sur cTrader Store, notamment les bots de trading, les indicateurs et les plug-ins, sont fournis par des développeurs tiers et mis à disposition à titre informatif et à des fins d'accès technique uniquement. cTrader Store n'est pas un courtier et ne fournit aucun conseil en investissement, aucune recommandation personnelle ni aucune garantie quant aux performances futures.
Plus de cet auteur


Prix
Depuis le 24/09/2024
4.44K
Installations gratuites