Logo "xhobaniFX_ADR-Lines"
xhobaniFX_ADR-Lines
Imej yang dimuat naik "xhobaniFX_ADR-Lines"

ADR High & Low Lines
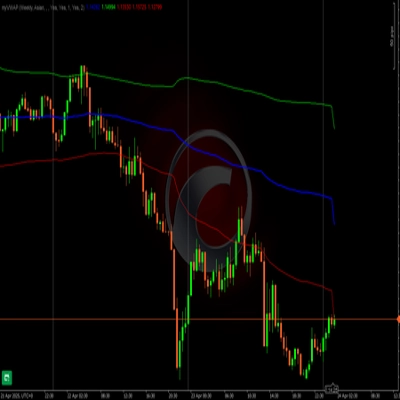
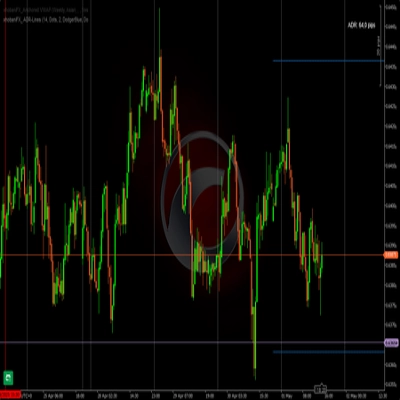
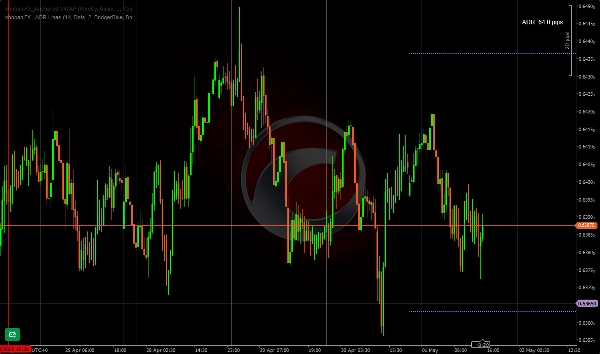
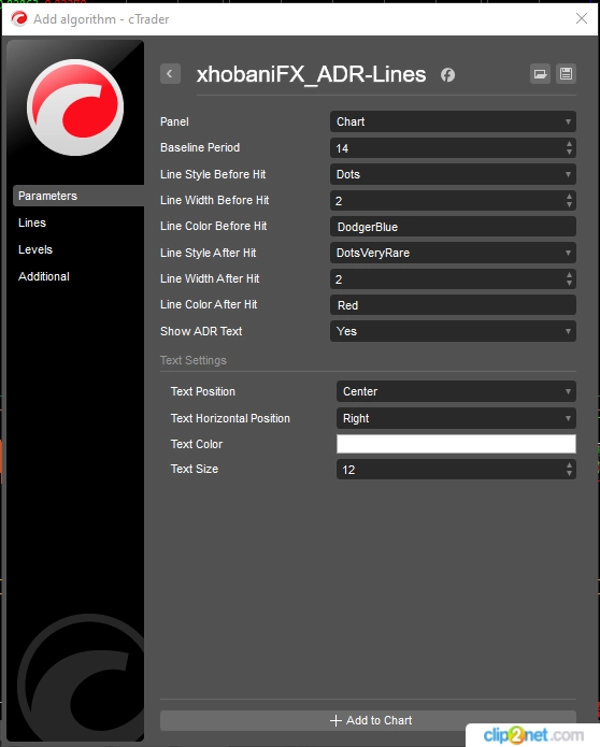
This ADR indicator plots horizontal lines for the current day's low/high based on the period the trader prefers. I like and use 14 days as a baseline period. It most suitable for scalpers/intraday traders. So you can easily notice when a high/low has been reached, you can choose the color/style/width of the lines to change to a different color of your choice once hit.

This indicator is developed in such a way that you can customize most of its parameters to suit your preferences and align with your workspace and colors.

Happy trading!
xhobani_FX

Indicator profile
0.0
Ulasan: 0
Ulasan pelanggan
Belum ada ulasan untuk produk ini. Anda sudah mencuba produk tersebut? Jadilah yang pertama untuk berkongsi pendapat anda!
Products available through cTrader Store, including trading bots, indicators and plugins, are provided by third-party developers and made available for informational and technical access purposes only. cTrader Store is not a broker and does not provide investment advice, personal recommendations or any guarantee of future performance.

Lebih banyak produk daripada penulis ini

xhobaniFX_Anchored VWAP: Volume Weighted Average

Anda juga mungkin suka

Bollinger Bands Width
Custom your Renko Bricks pips. Apply to any chart !
PVA Volume Analysis Indicator:Price volume over trend strength and direction
[Stellar Strategies] BOS Trend: Premium multi-timeframe BOS indicator for precision trend analysis.📈📉
Edge-aware clouds + Pro HUD: better entries, calmer exits, adaptive risk.
Where price swings, volume speaks
Candle Volume Profile for Crypto
VolumeProfileSuite is an advanced and flexible Volume Profile indicator for cTrader.
INDICATOR,LIQUIDITY POOLS,ACCURATE SIGNAL, NO DELAY,80% PROBABILITY
BB Breakout Oscillator with alerts! Spot trend reversals using Bollinger Bands. Bullish/Bearish crossovers Alerts.
Igor Levshin's Balance of Power measuring buyer vs seller strength for momentum and divergence analysis.
Session One is a tool for marking from to, useful if you've set the hours you want to trade
Option pricing using the BlackScholes model and the Math.Numerics packages
Identifies institutional zones with Volume Delta (K) across any asset or chart for high-precision entry detection.
Unlock VWAP in cTrader! Choose anchor periods, price sources, and display deviation bands with real-time tick updates.
Auto-swing detection driving 7 Fibonacci projections: retracement, expansion, fan, time, pitchfork, channel, Gann.
Right-anchored cTrader Volume Profile with VAH/VAL/POC, LVZ, top volume+EMA, themes, and fast, readable visuals.
Show each Market Session with full details, including grid mode for higher timeframes, statistics, and other metrics.